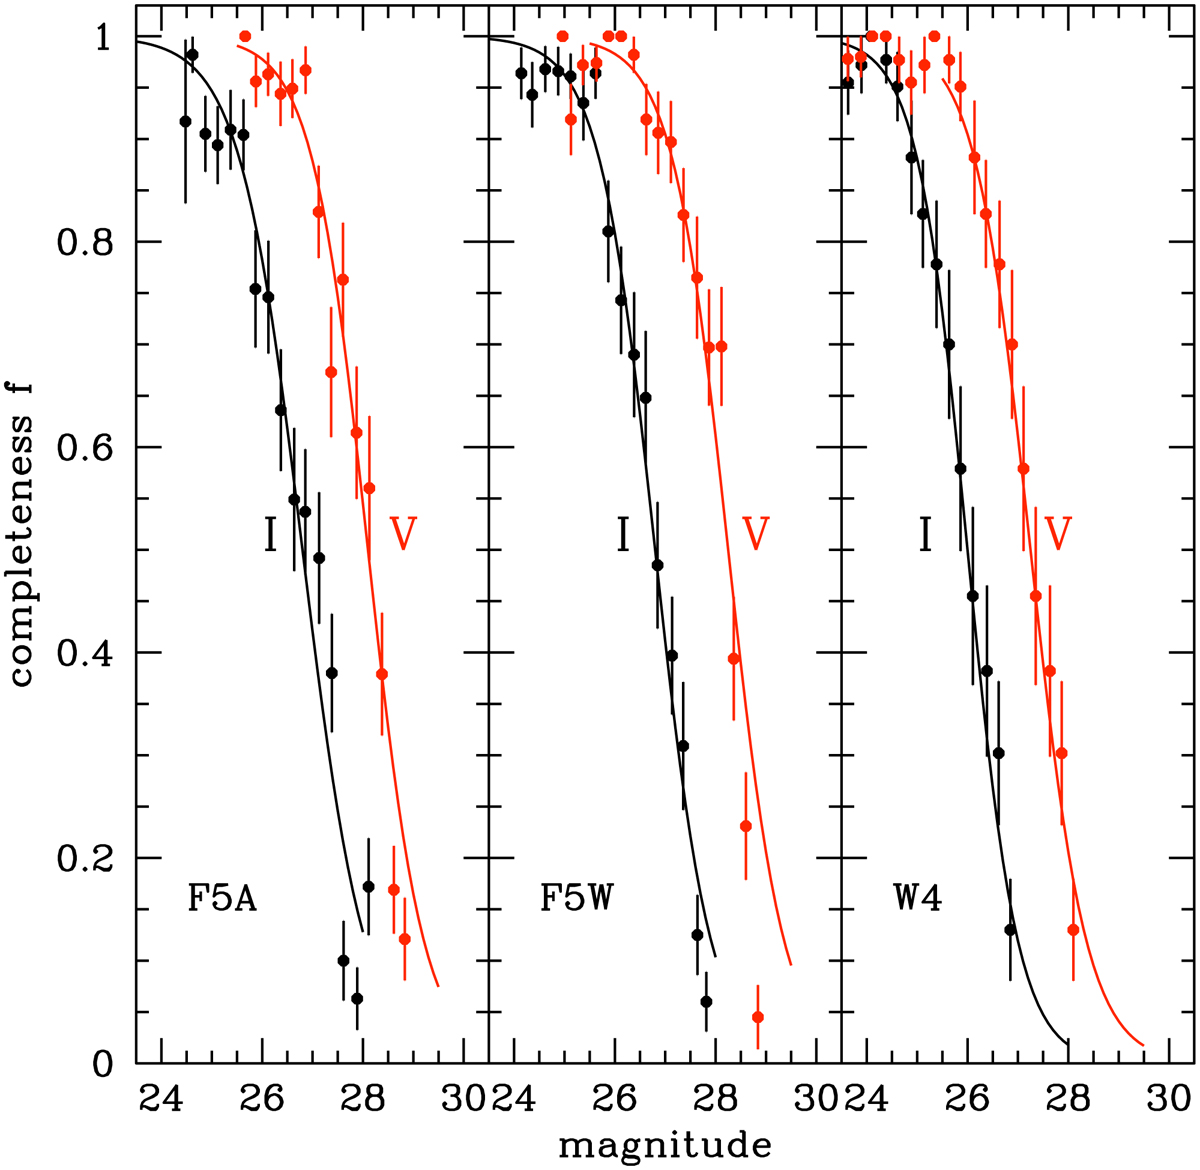
Fig. 2.
Download original image
Samples of daophot/addstar experiments for three different fields in our study. The completeness fraction f is plotted vs. V or I magnitude in each panel. The measured f-values per 0.25-mag bin are shown as the black (I) or red (V) points with error bars. The solid lines (black for I, red for V) show the smooth fitted curves of the form f = 1/(1 + eα(m − m0)) described in the text.
Current usage metrics show cumulative count of Article Views (full-text article views including HTML views, PDF and ePub downloads, according to the available data) and Abstracts Views on Vision4Press platform.
Data correspond to usage on the plateform after 2015. The current usage metrics is available 48-96 hours after online publication and is updated daily on week days.
Initial download of the metrics may take a while.