Fig. 13.
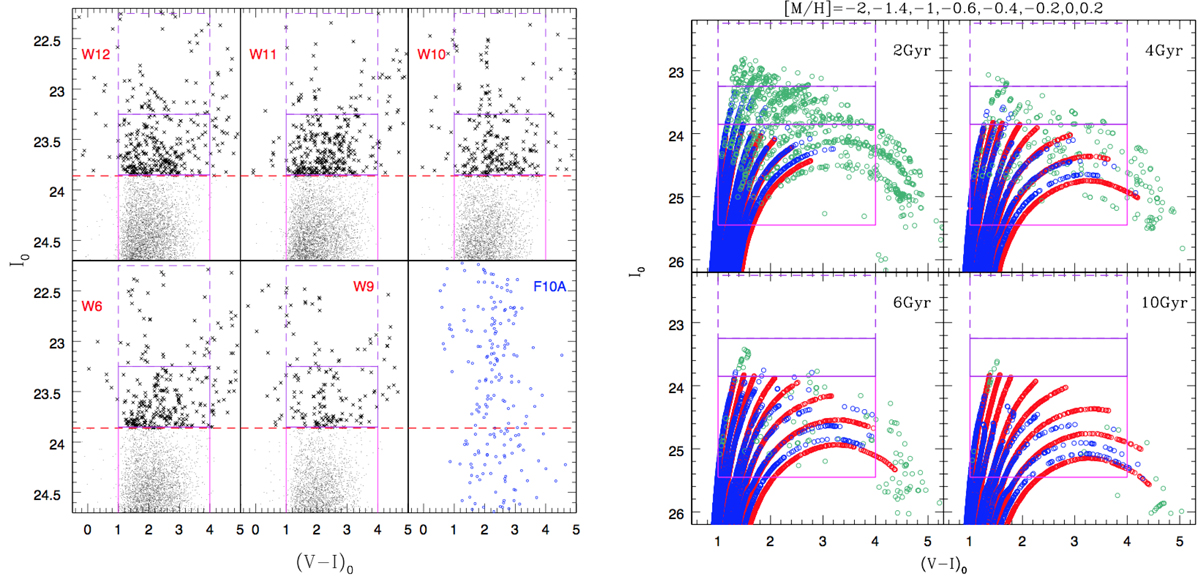
Download original image
Bright portion of CMDs of the five fields that show the highest excess of stars above the TRGB with stars brighter than the TRGB (dashed horizontal line at I0 = 23.86) plotted as crosses (left). These CMDs have been statistically cleaned from foreground contamination using observations in F10A shown in the lower right CMD. Padova stellar evolutionary isochrones for different metallicities listed at the top, and ages 2, 4, 6 and 10 Gyr (right). The isochrones have been shifted to the distance of NGC 5128 and are color-coded according to stellar evolutionary stage: RGB (red circles), early AGB (blue circles), and TP-AGB (green circles). The boxes indicate regions for which the mass-specific production factor Pj has been computed from the isochrones (see text).
Current usage metrics show cumulative count of Article Views (full-text article views including HTML views, PDF and ePub downloads, according to the available data) and Abstracts Views on Vision4Press platform.
Data correspond to usage on the plateform after 2015. The current usage metrics is available 48-96 hours after online publication and is updated daily on week days.
Initial download of the metrics may take a while.