Free Access
Fig. 11.
Download original image
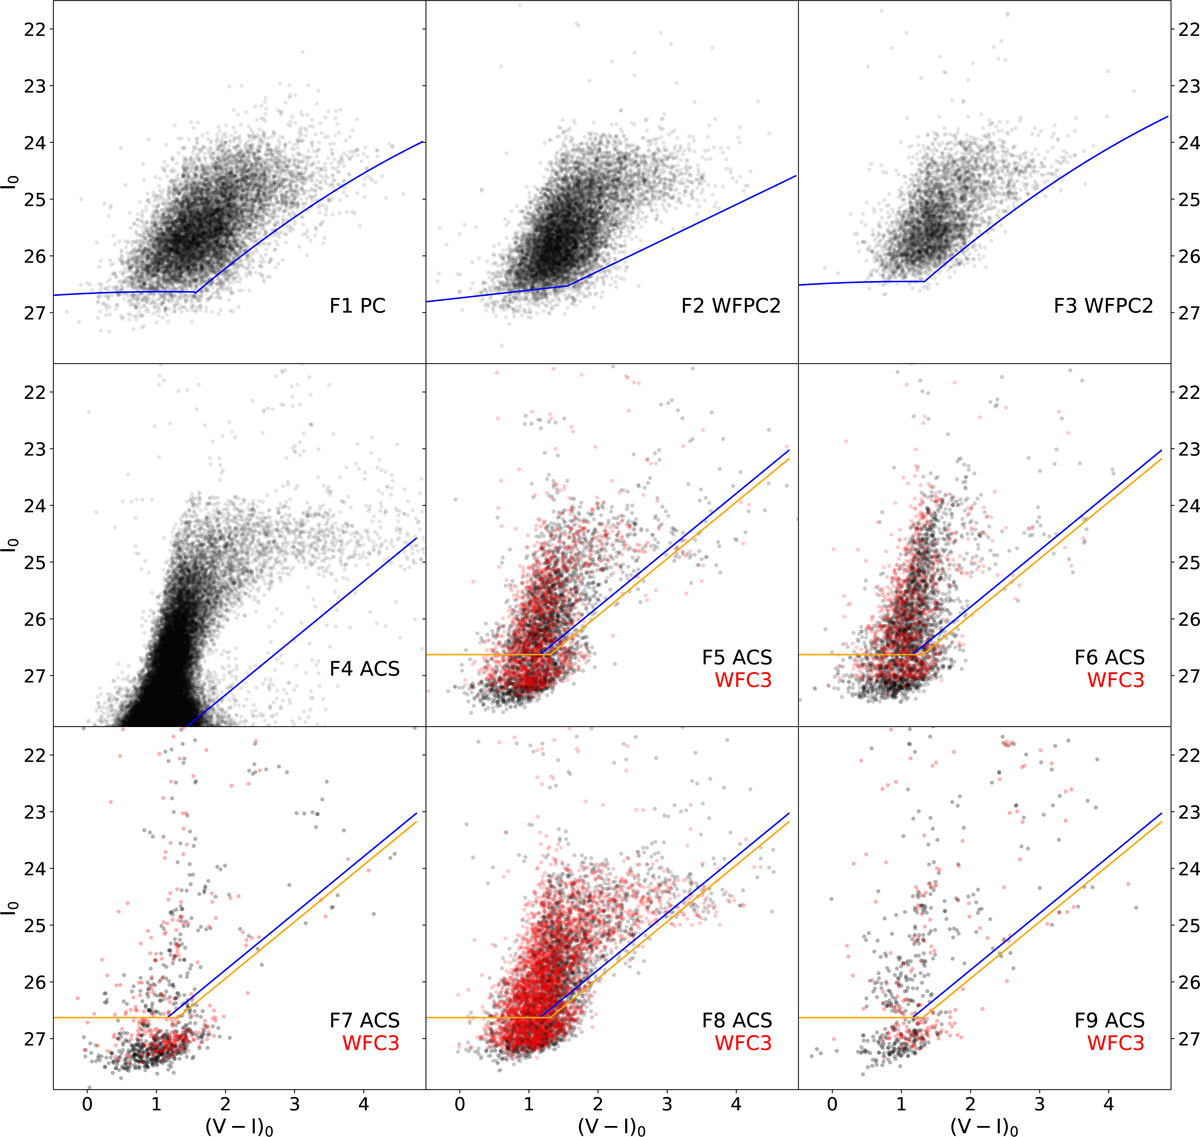
CMDs for fields F1–F9 after the point-by-point fore- and background decontamination described in the text. Data from ACS pointings are plotted as black dots, and those for WFC3 as red dots. The solid lines show the 50% detection completeness levels (ACS and WFPC2 in blue, WFC3 in orange).
Current usage metrics show cumulative count of Article Views (full-text article views including HTML views, PDF and ePub downloads, according to the available data) and Abstracts Views on Vision4Press platform.
Data correspond to usage on the plateform after 2015. The current usage metrics is available 48-96 hours after online publication and is updated daily on week days.
Initial download of the metrics may take a while.