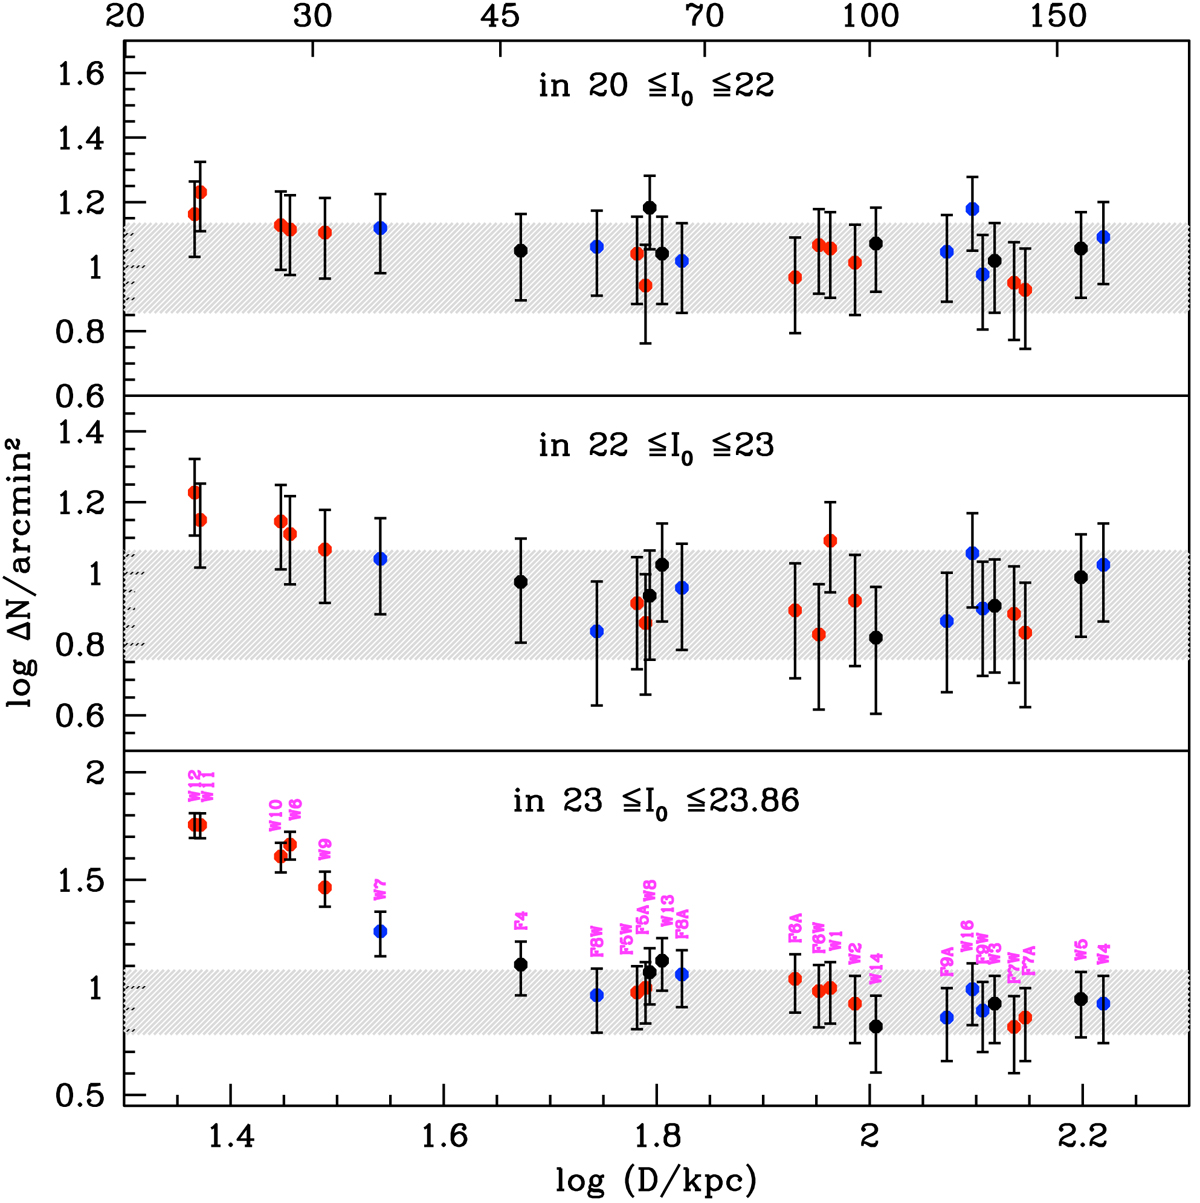
Fig. 10.
Download original image
Number of stars per arcmin2 in all observed fields as a function of distance in extinction-corrected I-band magnitude bins as labeled in each panel. The bottom x-axis is the distance corresponding to the semimajor axis of the elliptical isophote that goes through the field (assuming ellipticity of the outer halo e = 0.54 for all fields) in log and top x-axis in linear scale. Red (blue) dots highlight fields along, or close to, the major (minor) axis, and fields plotted with black dots are in between. The hashed horizontal band in each panel indicates the number of stars (with 1σ Poissonian error) in the background field F10A in the same magnitude bin.
Current usage metrics show cumulative count of Article Views (full-text article views including HTML views, PDF and ePub downloads, according to the available data) and Abstracts Views on Vision4Press platform.
Data correspond to usage on the plateform after 2015. The current usage metrics is available 48-96 hours after online publication and is updated daily on week days.
Initial download of the metrics may take a while.