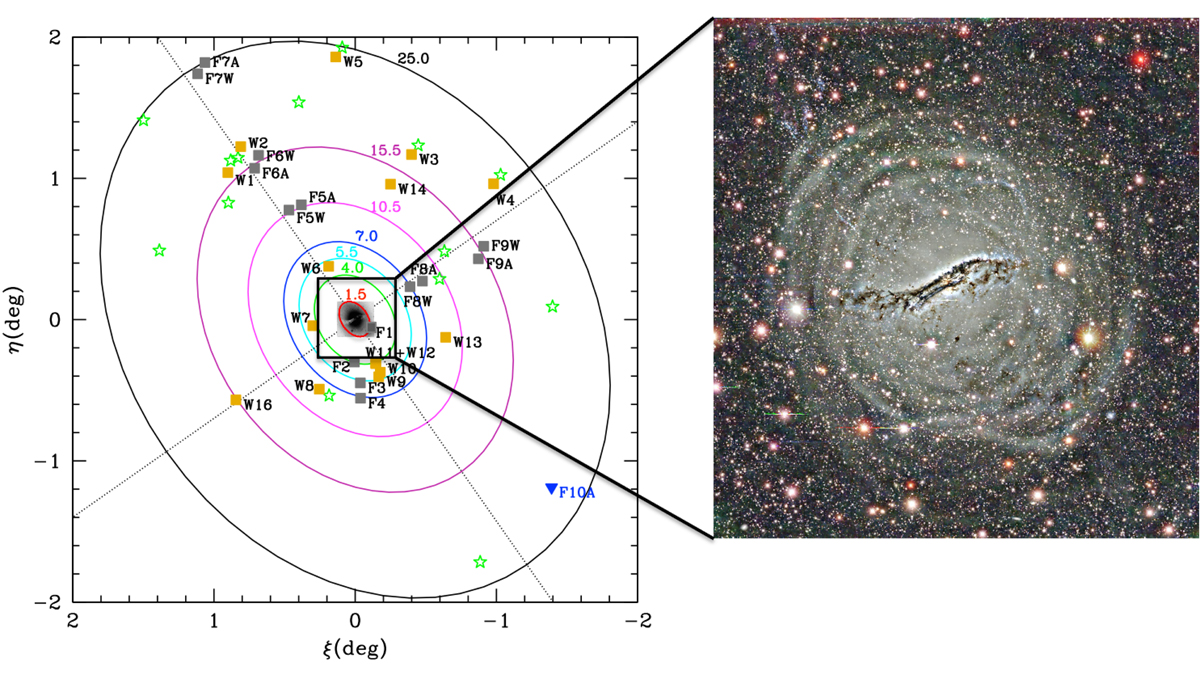
Fig. 1.
Download original image
Distribution of the fields imaged with the HST in F606W and F814W filters as listed in Table 1 relative to the center of NGC 5128 projected on the plane of the sky. Gray squares are fields F1–F9, orange squares are for WFC3 parallels W1–W16 from GO13856, and the blue inverted triangle is for the ACS parallel from GO15426. North is at the top and east at the left. The halo isophotal major axis is oriented 35° east of north (counterclockwise; Dufour et al. 1979). The elliptical contours have an axis ratio of 0.77 as determined from the inner halo (Dufour et al. 1979) and are plotted for 1.5, 4, 5.5, 7, 10.5, 15.5, and 25 Re distance (as indicated). The green stars are dwarf galaxies in the Cen A group as listed in Table 4 in Müller et al. (2019). Most of them have recently confirmed Cen A group membership based on the primary pointings from GO13856 (Crnojević et al. 2019). The large black square in the center indicates the relative size of the 35′×35′ (38.6 × 38.6 kpc2) unsharp-masked image of the shells in the central parts of the galaxy shown in the right panel (Peng et al. 2002, image credit: Eric Peng (JHU), Holland Ford (JHU/STScI), Ken Freeman (ANU), Rick White (STScI), and NOAO/AURA/NSF).
Current usage metrics show cumulative count of Article Views (full-text article views including HTML views, PDF and ePub downloads, according to the available data) and Abstracts Views on Vision4Press platform.
Data correspond to usage on the plateform after 2015. The current usage metrics is available 48-96 hours after online publication and is updated daily on week days.
Initial download of the metrics may take a while.