Fig. 8.
Download original image
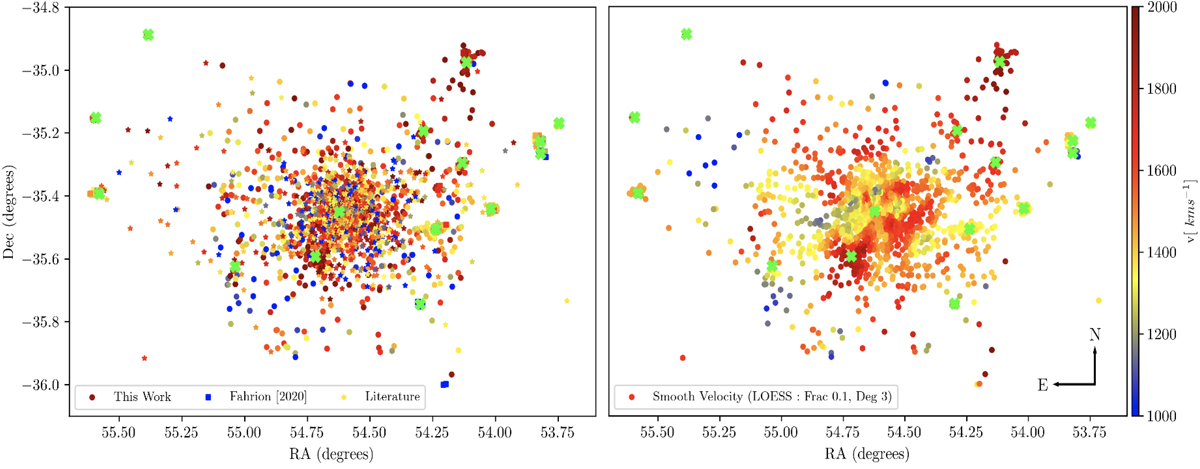
Radial velocity map of GCs within 1.5 square degrees of the Fornax cluster. Major galaxies are shown with green crosses. Left panel: GCs from this work are shown as dots. Squares and stars show GCs from Fahrion et al. (2020b) and previous literature measurements, respectively. Right panel: smooth velocity map using the LOESS technique. The smoothing parameters are given in the legend of the plot.
Current usage metrics show cumulative count of Article Views (full-text article views including HTML views, PDF and ePub downloads, according to the available data) and Abstracts Views on Vision4Press platform.
Data correspond to usage on the plateform after 2015. The current usage metrics is available 48-96 hours after online publication and is updated daily on week days.
Initial download of the metrics may take a while.