Fig. B.1.
Download original image
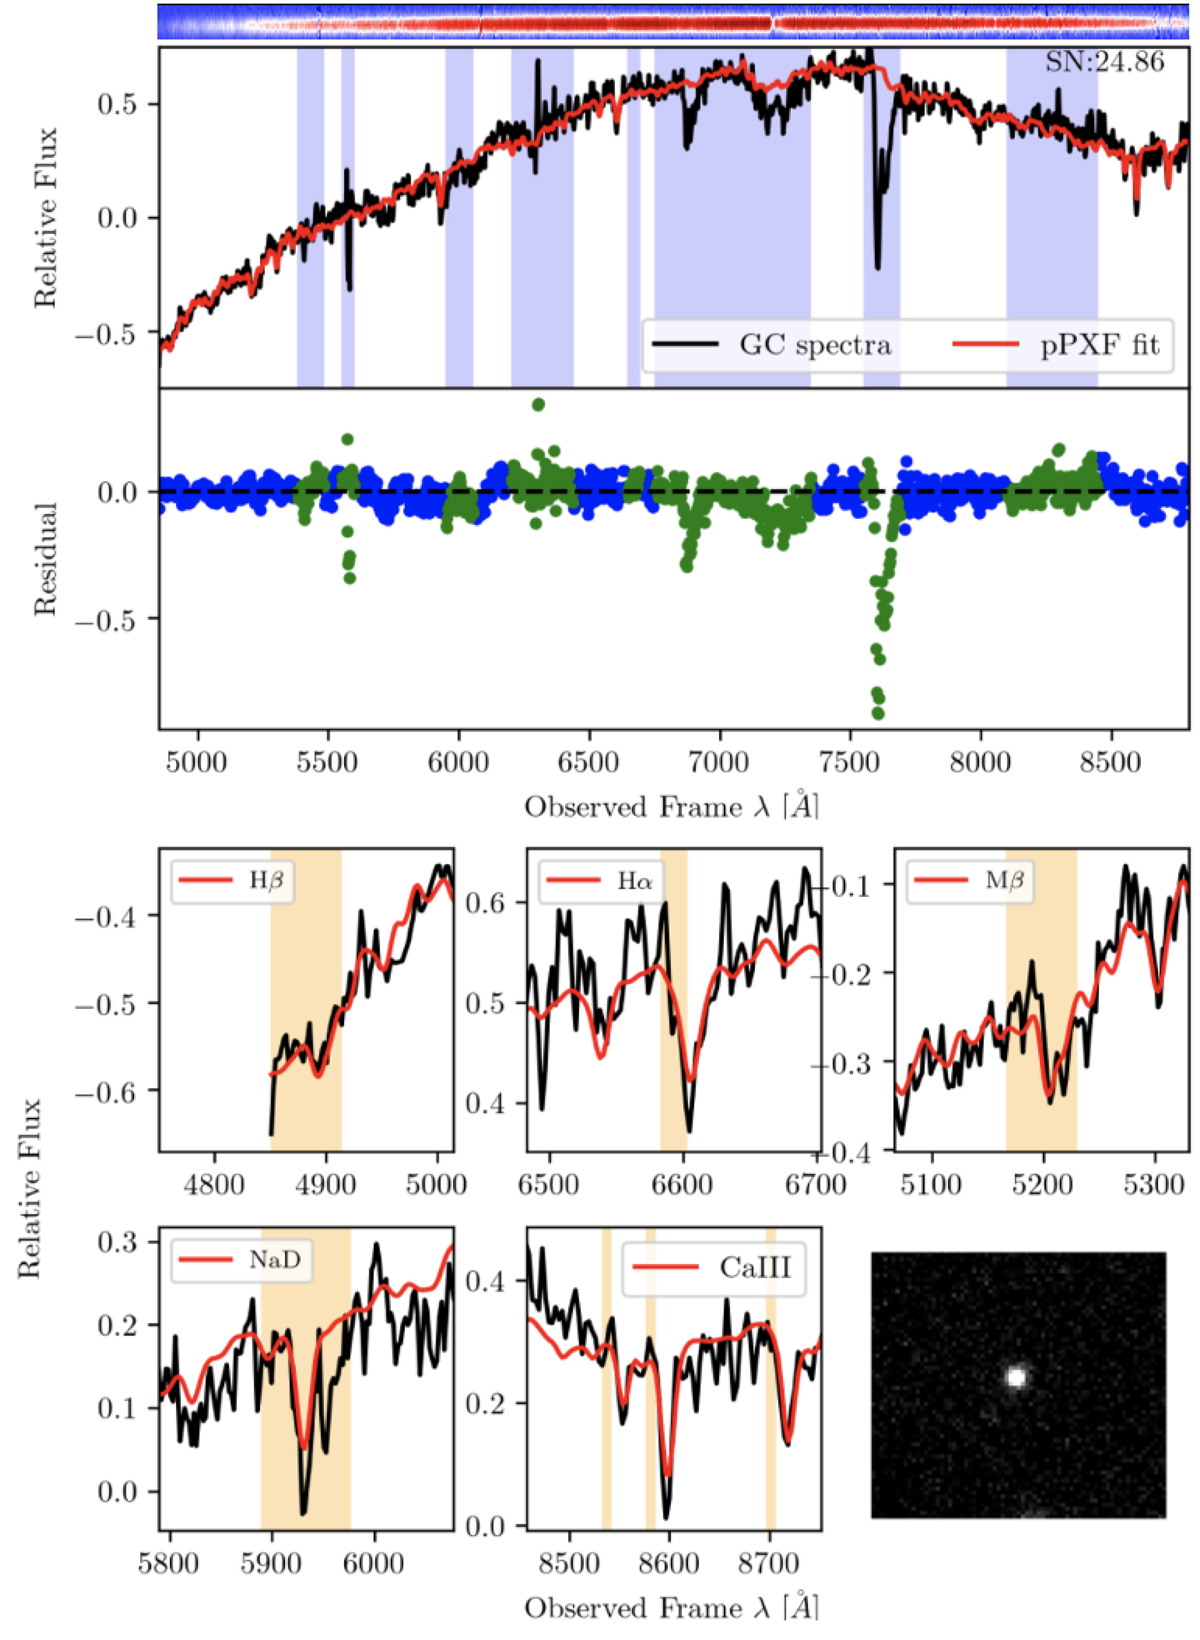
Example of a GC portfolio. The top panel shows the 1D extracted spectrum from the 2D VIMOS observation (on top). The middle panel shows the pPXF fit and its residuals in the subplot. The lower panel shows zoom-in wavelengths regions of absorption features used to visually select bonafide GCs. The lower right subpanel shows the 2D image of the GC from pre-imaging.
Current usage metrics show cumulative count of Article Views (full-text article views including HTML views, PDF and ePub downloads, according to the available data) and Abstracts Views on Vision4Press platform.
Data correspond to usage on the plateform after 2015. The current usage metrics is available 48-96 hours after online publication and is updated daily on week days.
Initial download of the metrics may take a while.