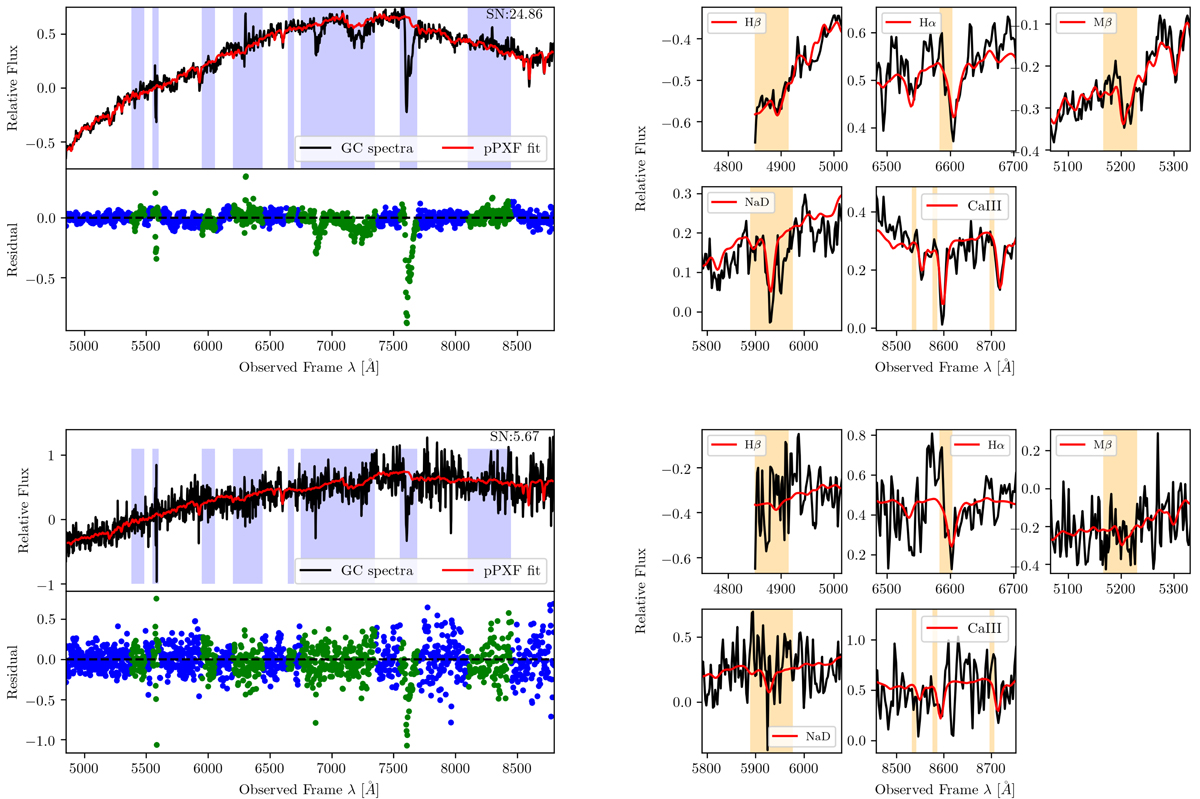
Fig. 2.
Download original image
Examples of pPXF fits to two GC spectra with different S/Ns. Top left panel: red and black show the pPXF fit and a GC spectrum with S/N ∼ 25. Masked regions are shown as blue bands. Blue and green dots in the lower subpanel show the residuals for unmasked and masked regions, respectively. Top right panel: a zoom-in view for the absorption features of Hβ, Mgβ, NaD, Hα, and the CaT lines. Orange bands in the subpanels show the expected position of absorption features at the Fornax cluster redshift. Two lower panels: same, but for a spectrum with S/N ∼ 6.
Current usage metrics show cumulative count of Article Views (full-text article views including HTML views, PDF and ePub downloads, according to the available data) and Abstracts Views on Vision4Press platform.
Data correspond to usage on the plateform after 2015. The current usage metrics is available 48-96 hours after online publication and is updated daily on week days.
Initial download of the metrics may take a while.