Fig. 18.
Download original image
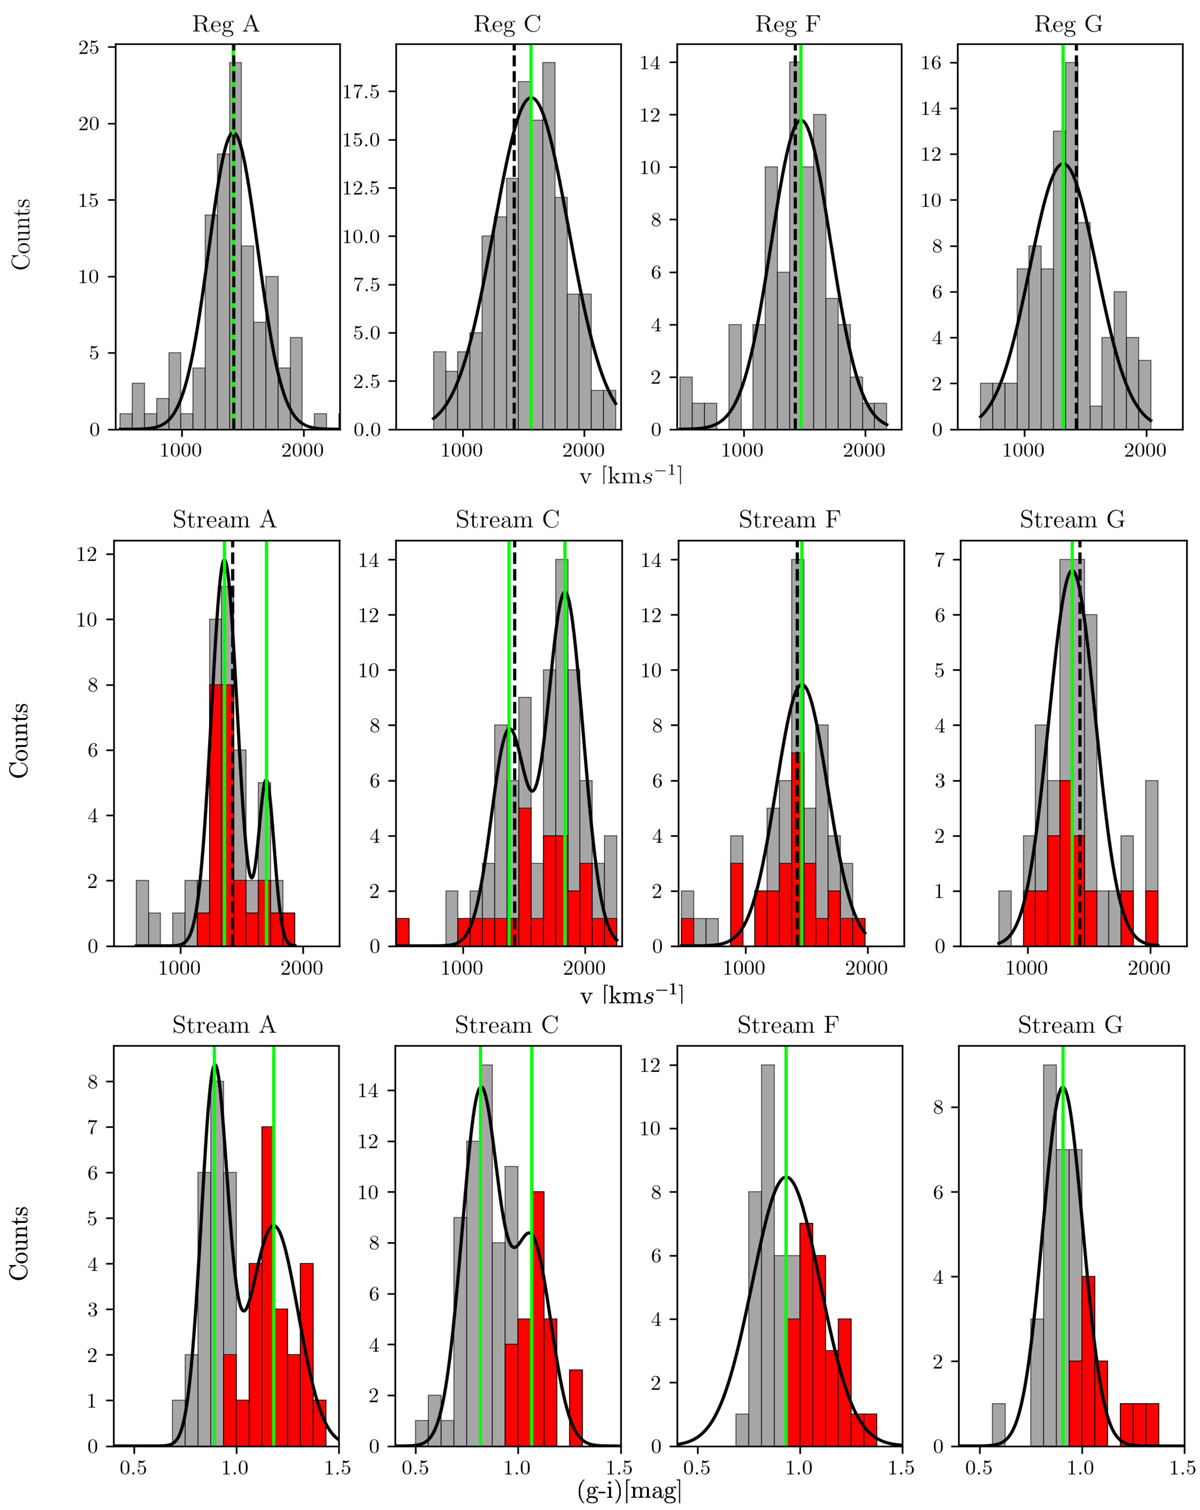
Radial velocity and g − i colour histograms of the intra-cluster regions. Top panel: radial velocity of GCs lying within the rectangular boxes A, C, F, and G (left to right). Middle panel: radial velocity of GCs lying within the streams A, C, F, and G (left to right). The radial velocities of the red GCs are marked in red. Bottom panel: g − i colour histogram of GCs lying within the streams A, C, F, and G (left to right). The dashed vertical black line marks the radial velocity of NGC 1399, and the vertical green lines show the peak positions of the fitted Gaussians. For streams A and C, double Gaussians were fitted.
Current usage metrics show cumulative count of Article Views (full-text article views including HTML views, PDF and ePub downloads, according to the available data) and Abstracts Views on Vision4Press platform.
Data correspond to usage on the plateform after 2015. The current usage metrics is available 48-96 hours after online publication and is updated daily on week days.
Initial download of the metrics may take a while.