Free Access
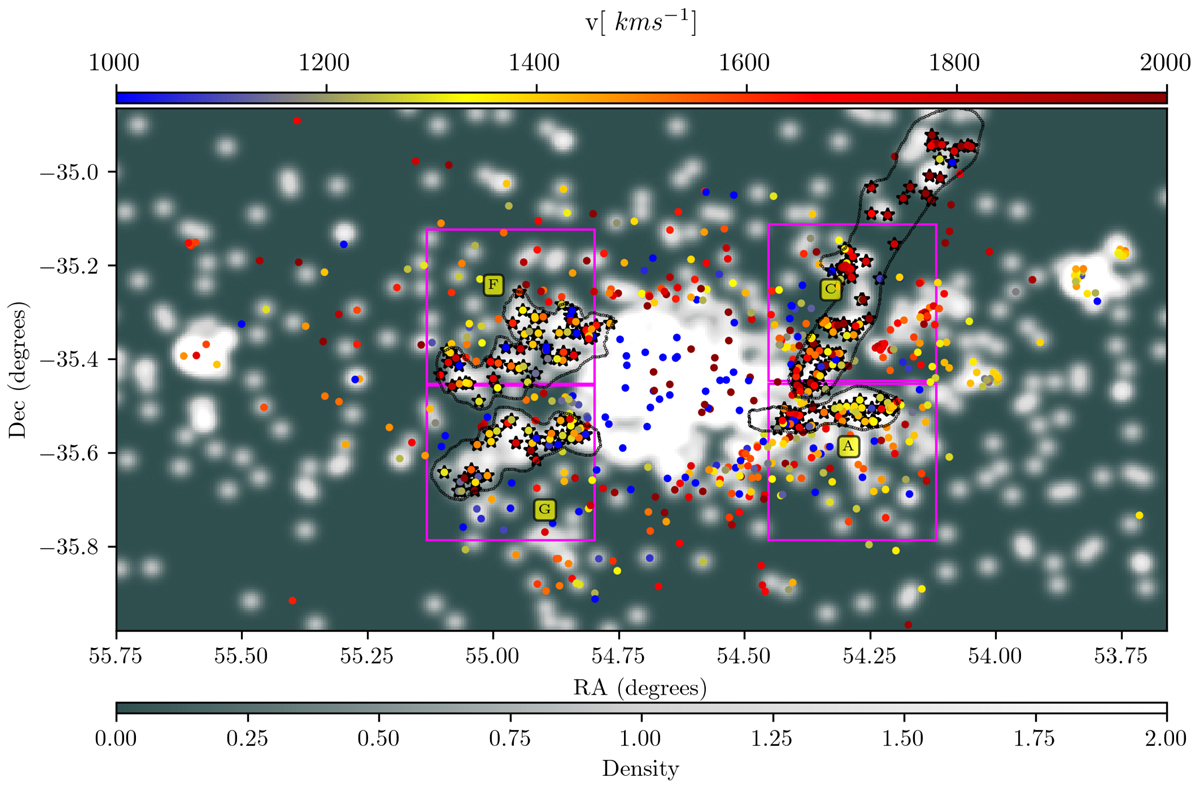
Fig. 17.
Download original image
Distribution of ICGCs selected with a phase-space cut at > 2reff. GC overdensity regions are named as in D’Abrusco et al. (2016). The magenta boxes show the regions in which we perform 2D KS tests. Black contours show the visibly selected regions to study the stream properties.
Current usage metrics show cumulative count of Article Views (full-text article views including HTML views, PDF and ePub downloads, according to the available data) and Abstracts Views on Vision4Press platform.
Data correspond to usage on the plateform after 2015. The current usage metrics is available 48-96 hours after online publication and is updated daily on week days.
Initial download of the metrics may take a while.