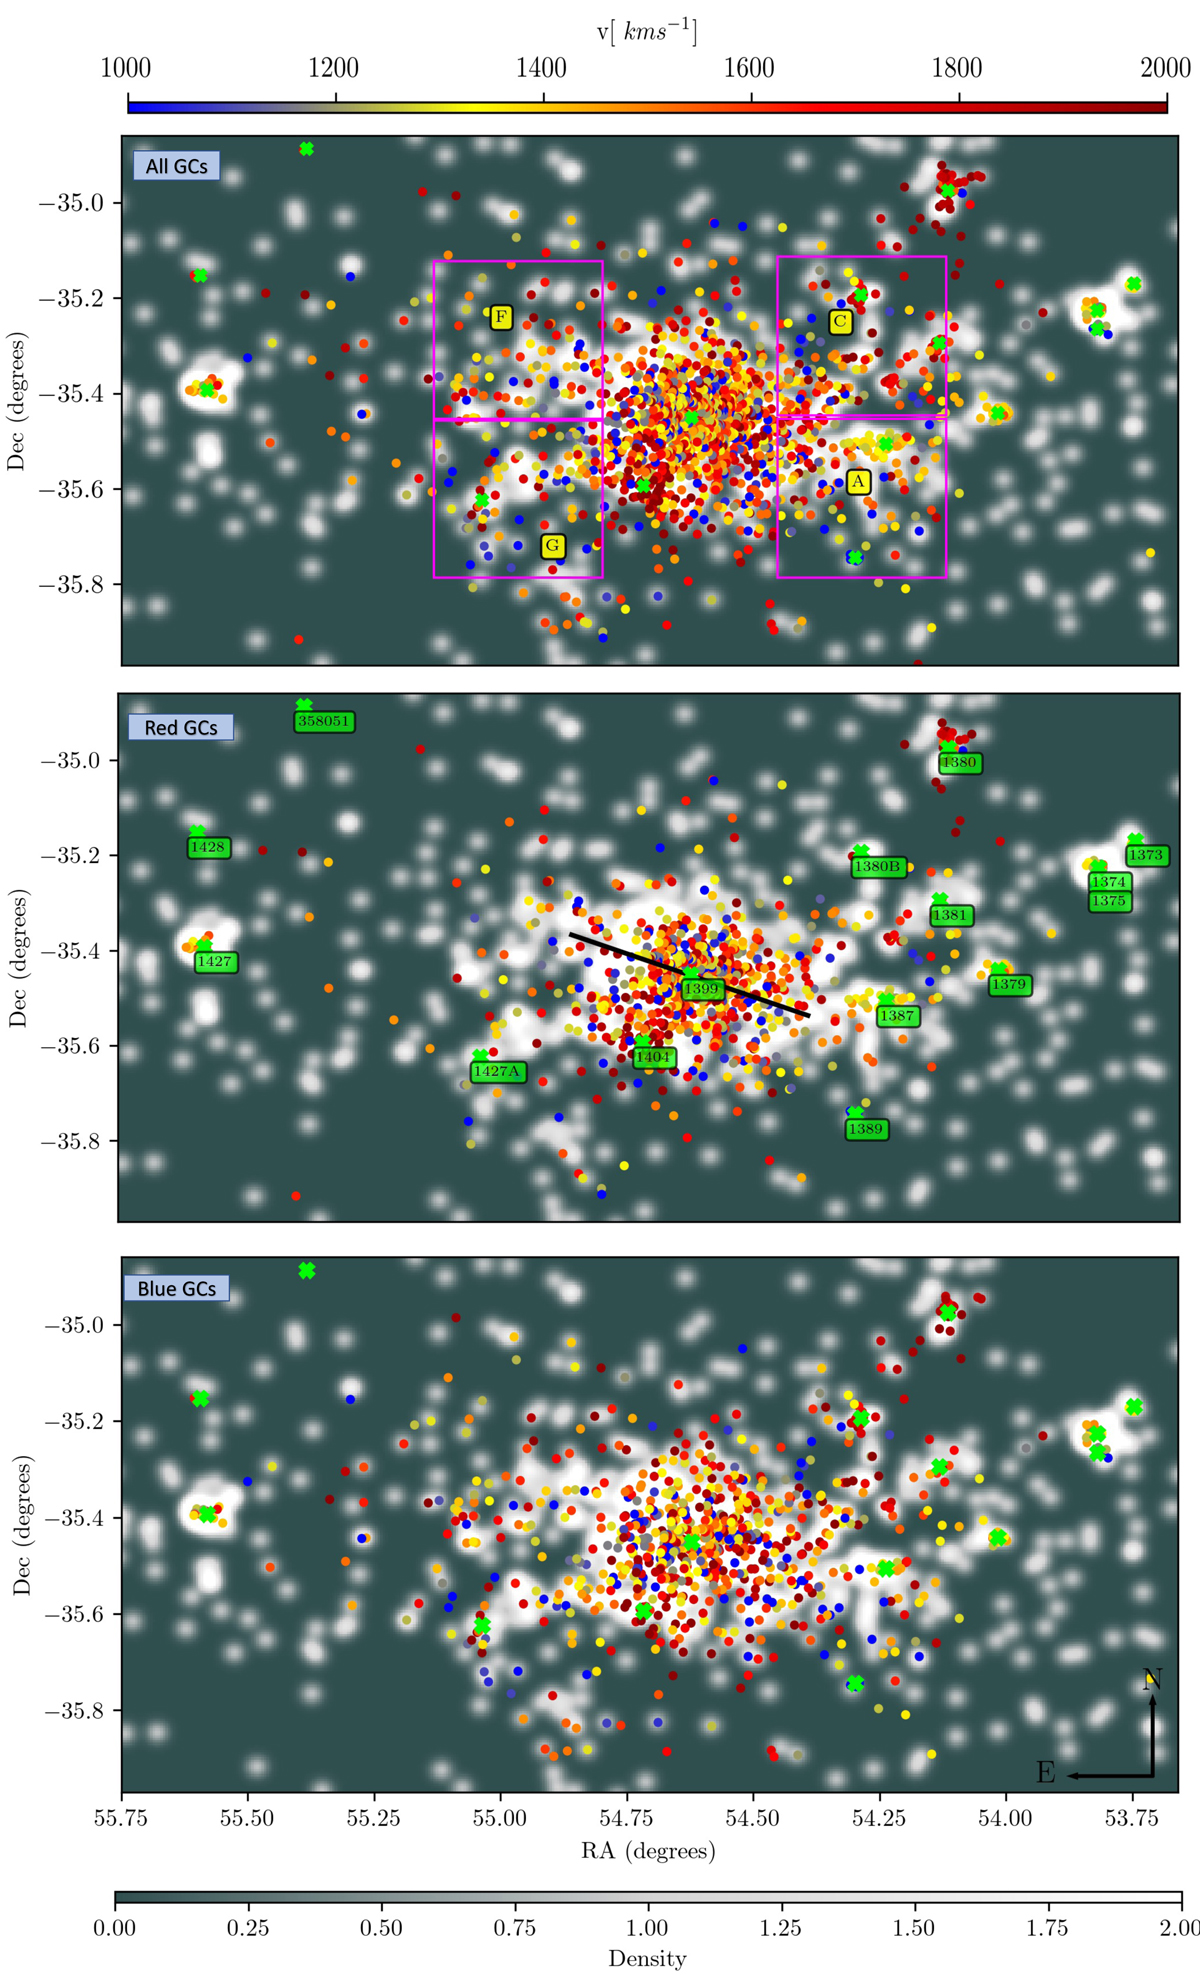
Fig. 15.
Download original image
Globular clusters with confirmed radial velocities (coloured dots) plotted over the surface density map of photometric GC candidates from the FDS (Cantiello et al. 2020). Top panel: full GC radial velocity sample. Middle panel: radial velocity distribution of red GCs. The black line shows the rotation axis of the red GCs at PA = 70°, measured north to east. Major galaxies are labelled in green. Bottom panel: same for blue GCs. The density scale plotted at the bottom represents the number of GCs from the photometric sample per square arcminute.
Current usage metrics show cumulative count of Article Views (full-text article views including HTML views, PDF and ePub downloads, according to the available data) and Abstracts Views on Vision4Press platform.
Data correspond to usage on the plateform after 2015. The current usage metrics is available 48-96 hours after online publication and is updated daily on week days.
Initial download of the metrics may take a while.