Free Access
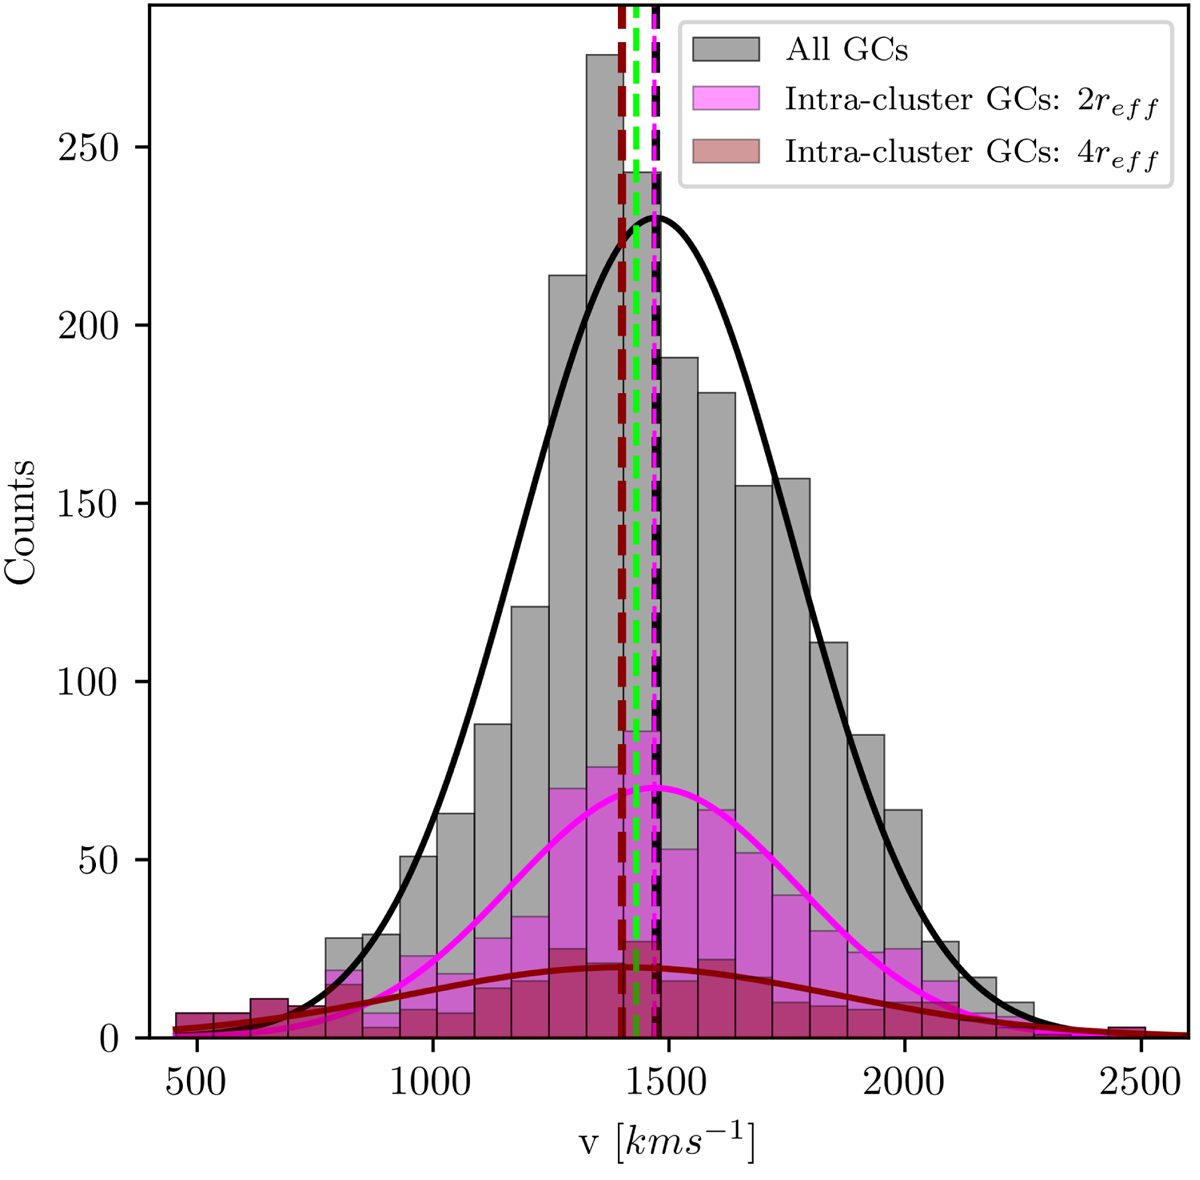
Fig. 14.
Download original image
Radial velocity histograms of the full sample and the intra-cluster GCs. The dashed vertical green line indicates the radial velocity of NGC 1399. The dashed vertical black, magenta, and dark red lines indicate the mean velocities of fitted Gaussian to the three sets of GCs.
Current usage metrics show cumulative count of Article Views (full-text article views including HTML views, PDF and ePub downloads, according to the available data) and Abstracts Views on Vision4Press platform.
Data correspond to usage on the plateform after 2015. The current usage metrics is available 48-96 hours after online publication and is updated daily on week days.
Initial download of the metrics may take a while.