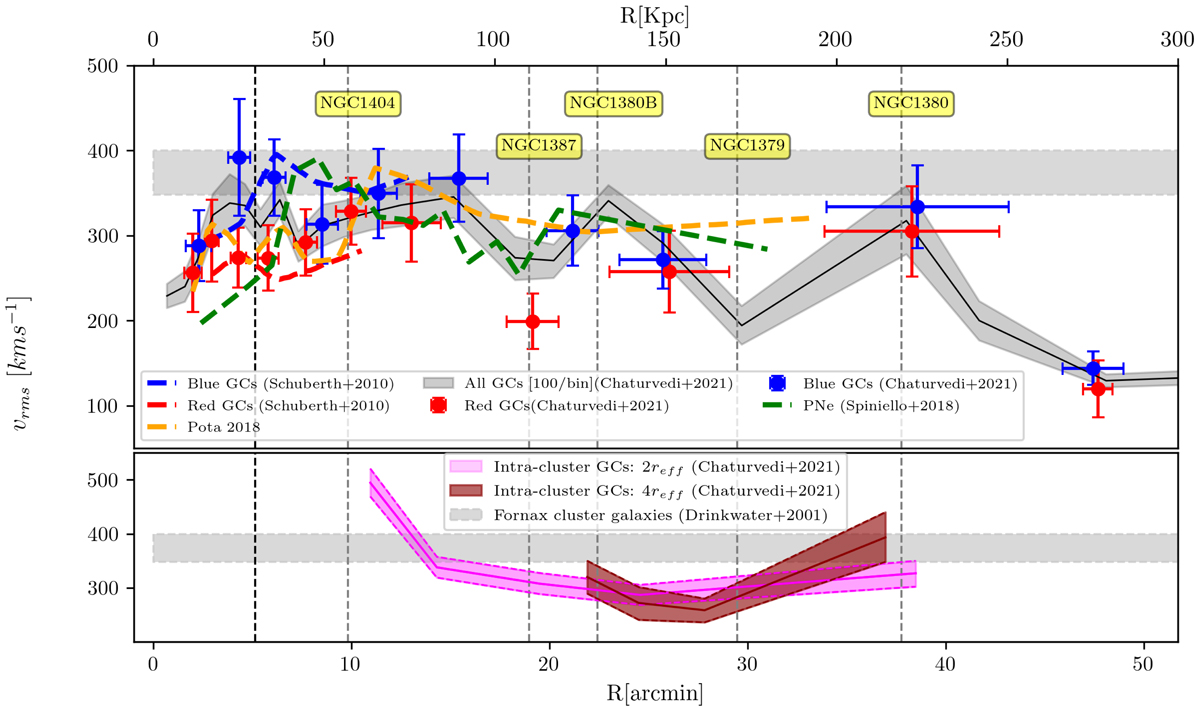
Fig. 12.
Download original image
Velocity dispersion profiles in the Fornax cluster core region as a function of projected distance from NGC 1399. Upper panel: black line denotes the dispersion profile of the complete sample of 2341 GCs. The grey band marks the 1σ uncertainty. Red and blue dots represent the values for the red and blue GCs, with 100 GCs per bin. The dashed blue and red lines represent the dispersion profiles for the GC analysis of the Schuberth et al. (2010) data. The dashed green and orange lines show the PNe and GC dispersion profiles from Spiniello et al. (2018) and Pota et al. (2018), respectively. The horizontal band denotes the velocity dispersion of the Fornax cluster galaxies (Drinkwater et al. 2000). The dashed vertical black line marks the effective radius of NGC 1399 and the dashed vertical grey lines the projected distances of major galaxies (as labelled) from NGC 1399. Lower panel: dispersion profile of ICGC candidates with two different selections. The pink line shows ICGCs and outer halo GCs selected farther than 2reff away from major galaxies, and the light pink band represents the 1σ uncertainty. The dark red line represents ICGCs that were selected outside 4reff around major galaxies (see text for details), and the lighter red band denotes its 1σ uncertainty.
Current usage metrics show cumulative count of Article Views (full-text article views including HTML views, PDF and ePub downloads, according to the available data) and Abstracts Views on Vision4Press platform.
Data correspond to usage on the plateform after 2015. The current usage metrics is available 48-96 hours after online publication and is updated daily on week days.
Initial download of the metrics may take a while.