Fig. 11.
Download original image
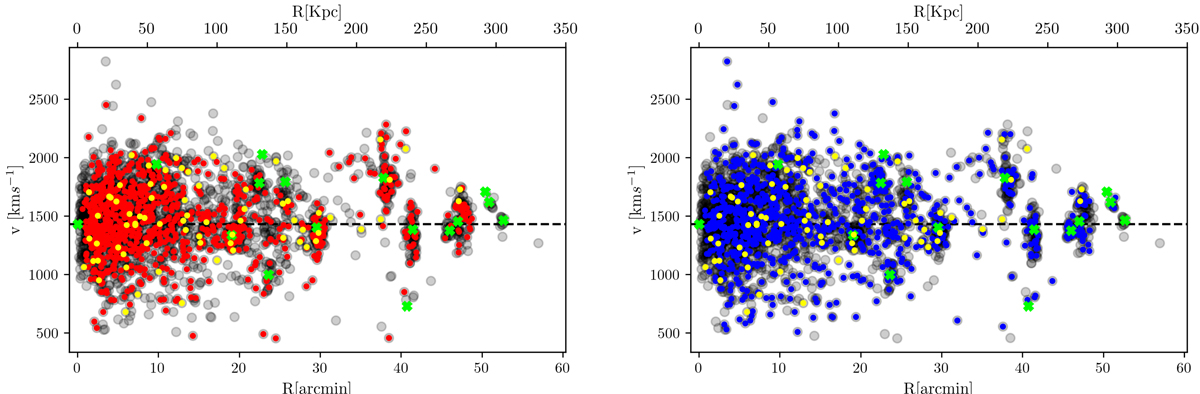
Phase-space diagrams of radial velocity vs. cluster-centric distance. In both panels the grey dots show the full sample, the green crosses major galaxies within 300 kpc, and the dashed horizontal lines mark the systemic velocity of NGC 1399. Left panel: velocity distribution for red GCs. Right panel: same for blue GCs. Yellow dots indicate UCDs, and the green crosses mark the major galaxies of the Fornax cluster.
Current usage metrics show cumulative count of Article Views (full-text article views including HTML views, PDF and ePub downloads, according to the available data) and Abstracts Views on Vision4Press platform.
Data correspond to usage on the plateform after 2015. The current usage metrics is available 48-96 hours after online publication and is updated daily on week days.
Initial download of the metrics may take a while.