Free Access
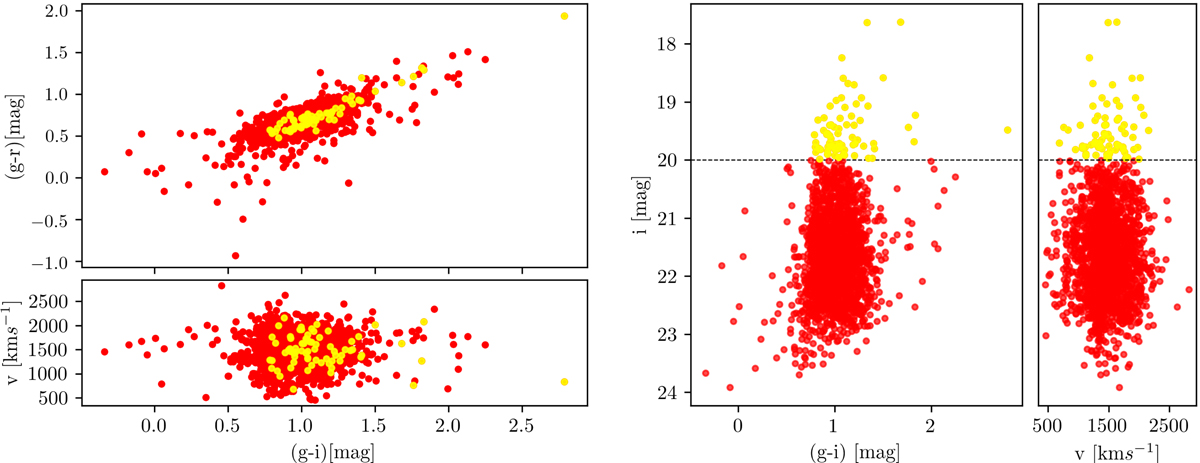
Fig. 10.
Download original image
Distribution of GCs (red dots) and UCDs (yellow dots) in the colour-colour and colour-magnitude diagram. Left panel: distribution of GCs in the (g − r) vs (g − r) space. The lower subplot shows the radial velocity as a function of (g − i) colour. Right panel: same as right panel, but in i mag vs. (g − i) space.
Current usage metrics show cumulative count of Article Views (full-text article views including HTML views, PDF and ePub downloads, according to the available data) and Abstracts Views on Vision4Press platform.
Data correspond to usage on the plateform after 2015. The current usage metrics is available 48-96 hours after online publication and is updated daily on week days.
Initial download of the metrics may take a while.