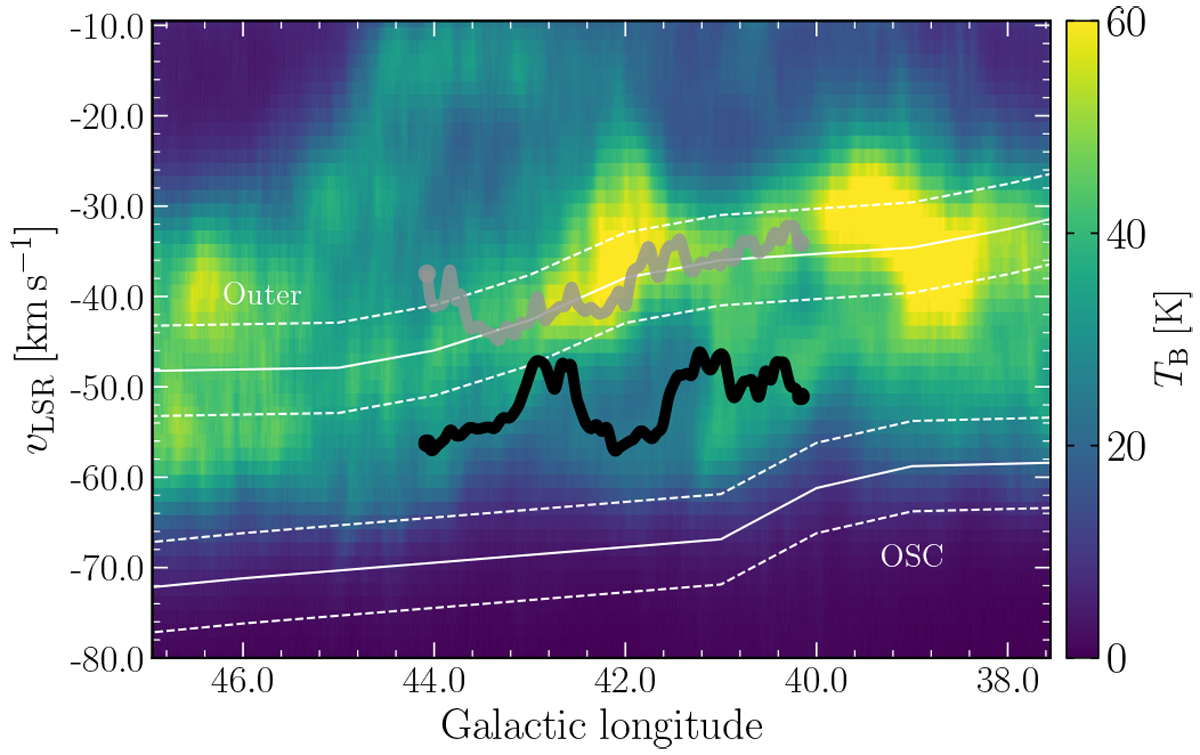
Fig. 7
Download original image
Position-velocity diagram of H I. The colored background shows the H I emission averaged over − 1.25° < b < +1.25°. The black and gray curve indicate the intensity-weighted average velocity of Maggie and the second fit component at each longitude as given by the GAUSSPY+ decomposition, respectively. The white line segments give the predicted spiral arm centroids of the Outer arm and Outer-Scutum-Centaurus (OSC) arm along with their uncertainties (dashed lines) in velocity (Reid et al. 2019).
Current usage metrics show cumulative count of Article Views (full-text article views including HTML views, PDF and ePub downloads, according to the available data) and Abstracts Views on Vision4Press platform.
Data correspond to usage on the plateform after 2015. The current usage metrics is available 48-96 hours after online publication and is updated daily on week days.
Initial download of the metrics may take a while.