Fig. 6
Download original image
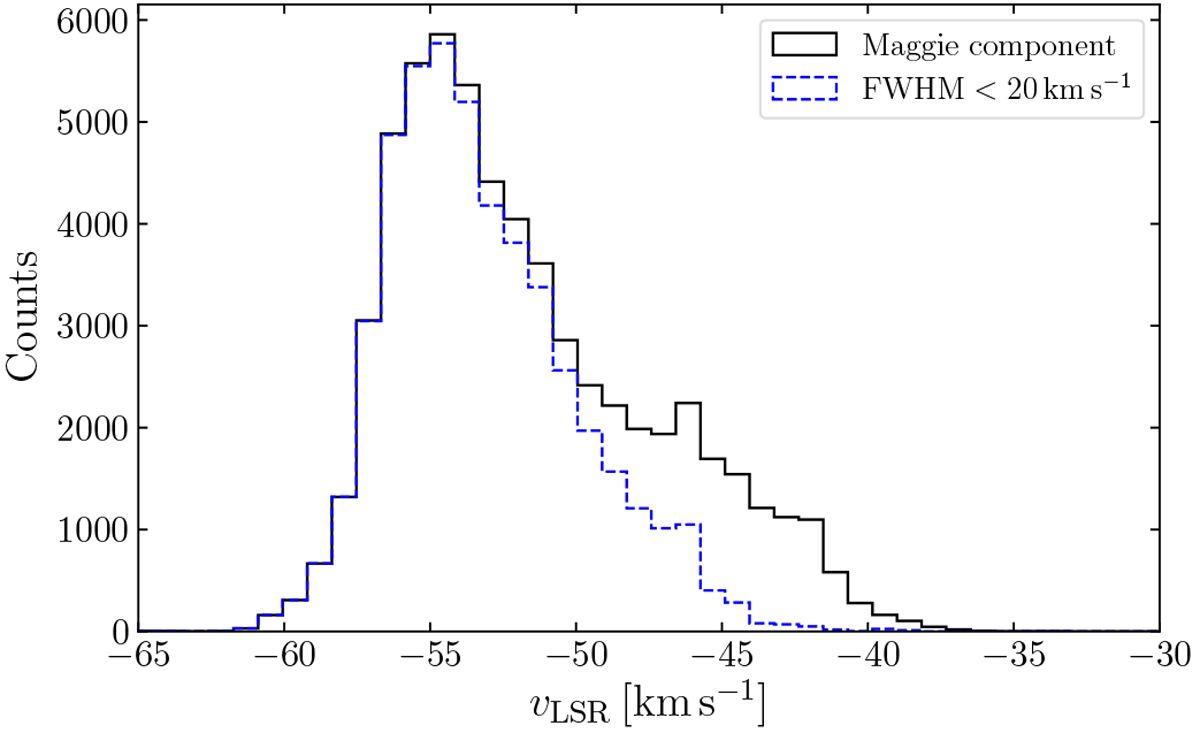
Histograms of fit peak velocities of Maggie. The black histogram shows the distribution of the centroid velocities at all pixel positions inferred from the GAUSSPY+ fits along the 40 pc -wide spine of thefilament. The blue histogram shows the peak velocity distribution corresponding to components with line widths Δv < 20 km s−1.
Current usage metrics show cumulative count of Article Views (full-text article views including HTML views, PDF and ePub downloads, according to the available data) and Abstracts Views on Vision4Press platform.
Data correspond to usage on the plateform after 2015. The current usage metrics is available 48-96 hours after online publication and is updated daily on week days.
Initial download of the metrics may take a while.