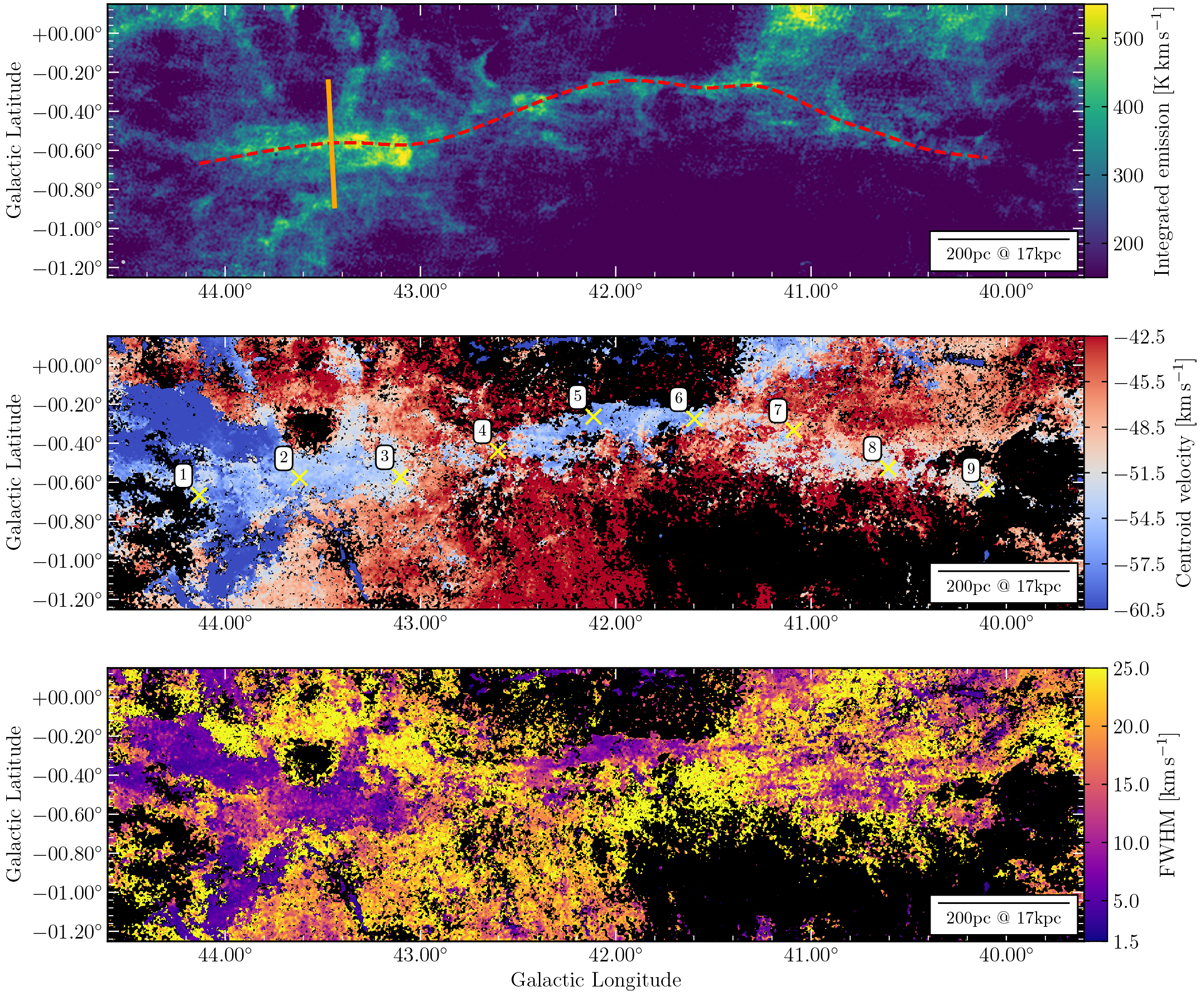
Fig. 3
Download original image
Kinematic overview of the Maggie filament. Top panel: integrated H I emission in the velocity interval between −57.5 and −48.5 km s−1. The red dashed curve marks the spine of the filament. The orange line perpendicular to the spine marks the cut of the average emission profile shown in black in the upper panel of Fig. 4. Middle panel: centroid velocities of the first (or single) component derived from the GAUSSPY+ decomposition of the emission spectra. The fits are restricted to the velocity range − 71 ≤ vLSR ≤−23 km s−1. The yellow crosses mark the positions of the spectra shown in Fig. 2. Bottom panel: corresponding line widths in terms of the full width at half maximum (FWHM). Both maps are clipped at 5σ (~20 K).
Current usage metrics show cumulative count of Article Views (full-text article views including HTML views, PDF and ePub downloads, according to the available data) and Abstracts Views on Vision4Press platform.
Data correspond to usage on the plateform after 2015. The current usage metrics is available 48-96 hours after online publication and is updated daily on week days.
Initial download of the metrics may take a while.