Fig. 2
Download original image
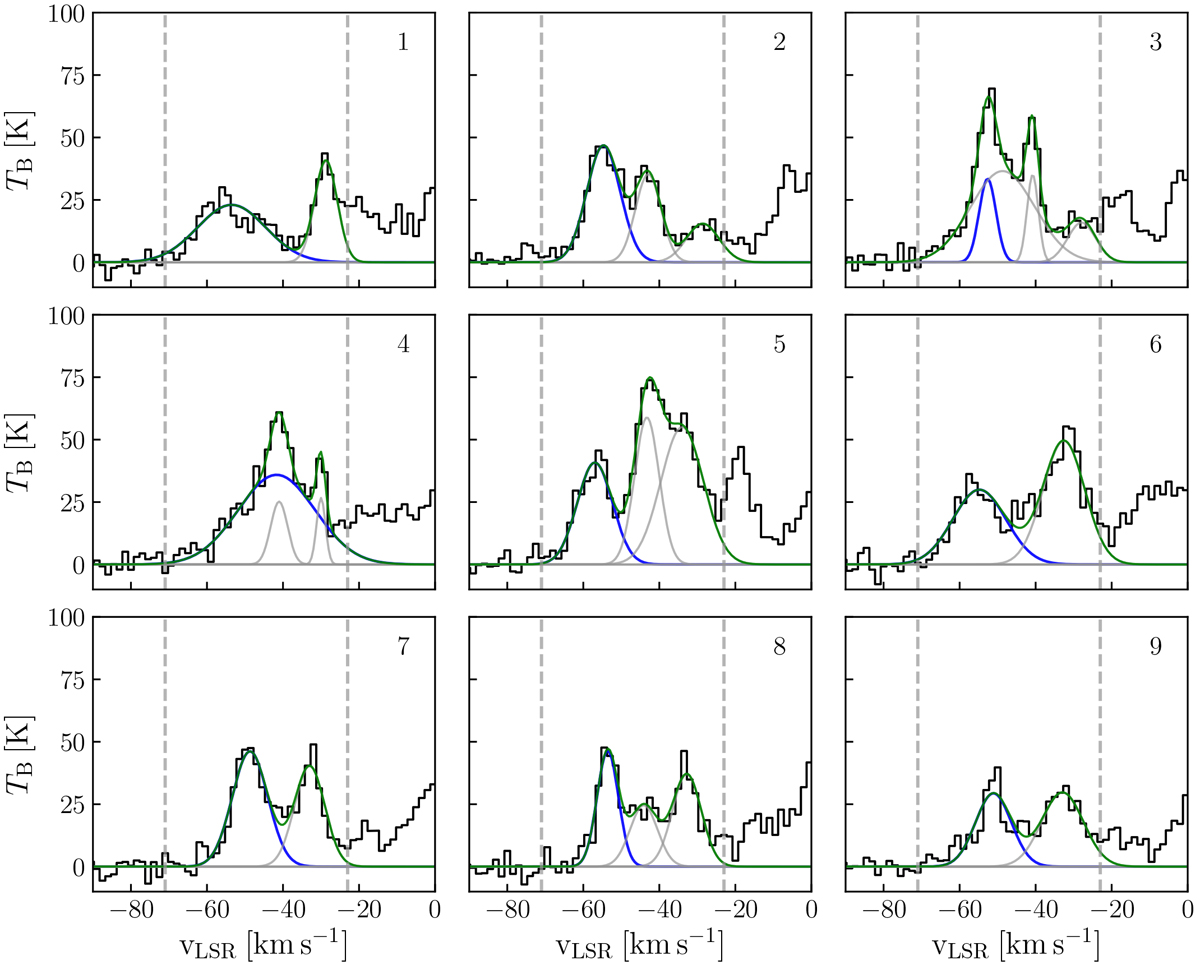
H I spectra and GAUSSPY+ decomposition results along the filament. The black curves show H I spectra corresponding to the positions marked in the middle panel of Fig. 3. The vertical dashed lines at − 71 and − 23 km s−1 mark the velocity range taken into account for the GAUSSPY+ decomposition. The blue curve in each panel shows the first (i.e., lowest-centroid-velocity) component, which we attribute to Maggie. The gray curves show all additional components that were fit. The green curve represents the total spectrum fit in the considered velocity range.
Current usage metrics show cumulative count of Article Views (full-text article views including HTML views, PDF and ePub downloads, according to the available data) and Abstracts Views on Vision4Press platform.
Data correspond to usage on the plateform after 2015. The current usage metrics is available 48-96 hours after online publication and is updated daily on week days.
Initial download of the metrics may take a while.