Fig. 14
Download original image
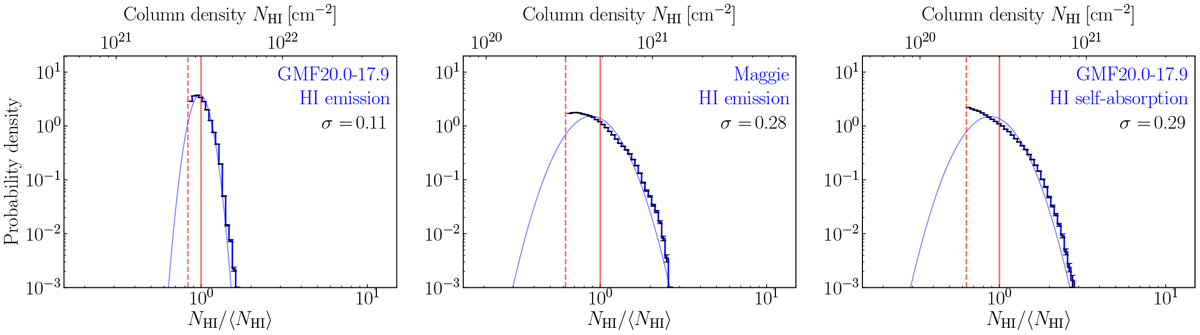
Comparison of N-PDFs. The blue histograms show the column density distributions of Maggie (middle panel) in comparison with the N-PDFs taken from a different GMF region analyzed in Syed et al. (2020) that trace the midplane H I emission (left) and CNM by means of H I self-absorption (right). The blue curve in each panel indicates a log-normal fit to the distribution. The red vertical dashed and solid lines mark the column density thresholds taken into account and the mean column density, respectively.
Current usage metrics show cumulative count of Article Views (full-text article views including HTML views, PDF and ePub downloads, according to the available data) and Abstracts Views on Vision4Press platform.
Data correspond to usage on the plateform after 2015. The current usage metrics is available 48-96 hours after online publication and is updated daily on week days.
Initial download of the metrics may take a while.