Open Access
Fig. 12
Download original image
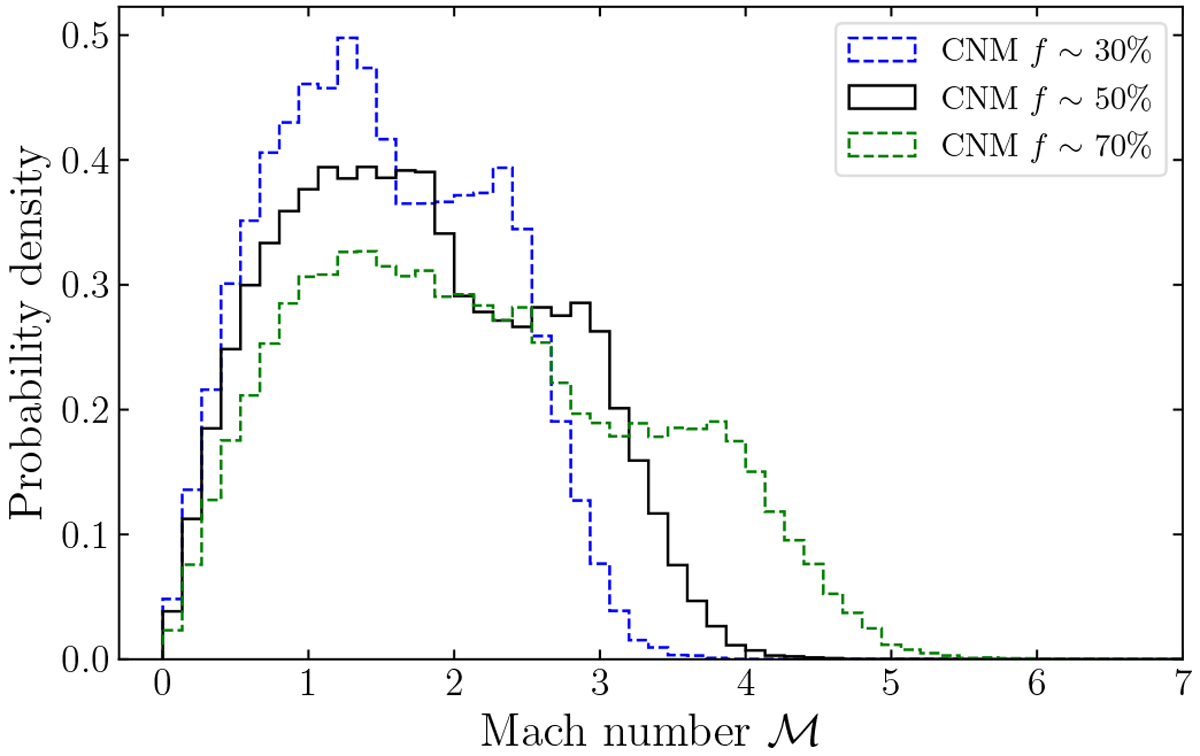
Mach number distribution of Maggie. The blue, black, and green histograms show the Mach number distributions assuming a CNM fraction of 30, 50, and 70%, respectively. Each distribution is computed using a single thermal line width and sound speed inferred from a weighted mean kinetic temperature.
Current usage metrics show cumulative count of Article Views (full-text article views including HTML views, PDF and ePub downloads, according to the available data) and Abstracts Views on Vision4Press platform.
Data correspond to usage on the plateform after 2015. The current usage metrics is available 48-96 hours after online publication and is updated daily on week days.
Initial download of the metrics may take a while.