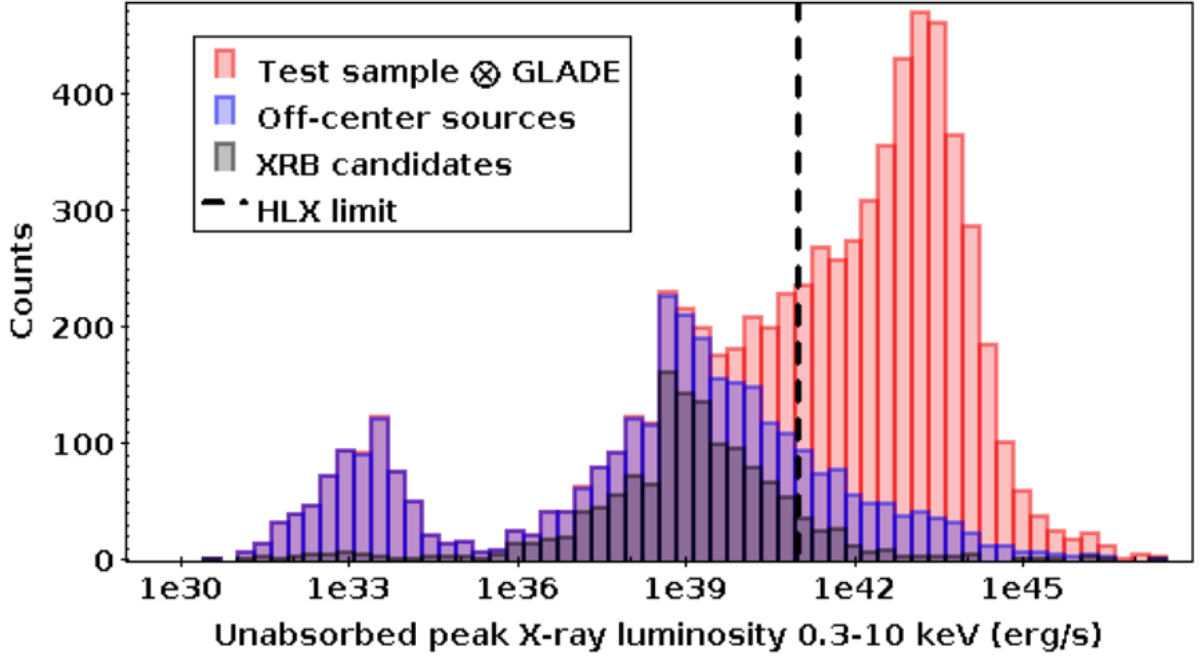
Fig. 7.
Download original image
Distribution of the X-ray peak luminosity of Swift sources matching a galaxy from GLADE. Only sources with at least two quality rules and reasonable quality flags are selected. The blue bars show the subset of off-center sources, i.e., sources whose error circle does not match the galaxy center. The dark gray bars show a subset of these sources, made of good XRB candidates (candidates with ℙ(XRB) > 2ℙ(c) for every other class c).
Current usage metrics show cumulative count of Article Views (full-text article views including HTML views, PDF and ePub downloads, according to the available data) and Abstracts Views on Vision4Press platform.
Data correspond to usage on the plateform after 2015. The current usage metrics is available 48-96 hours after online publication and is updated daily on week days.
Initial download of the metrics may take a while.