Fig. 6.
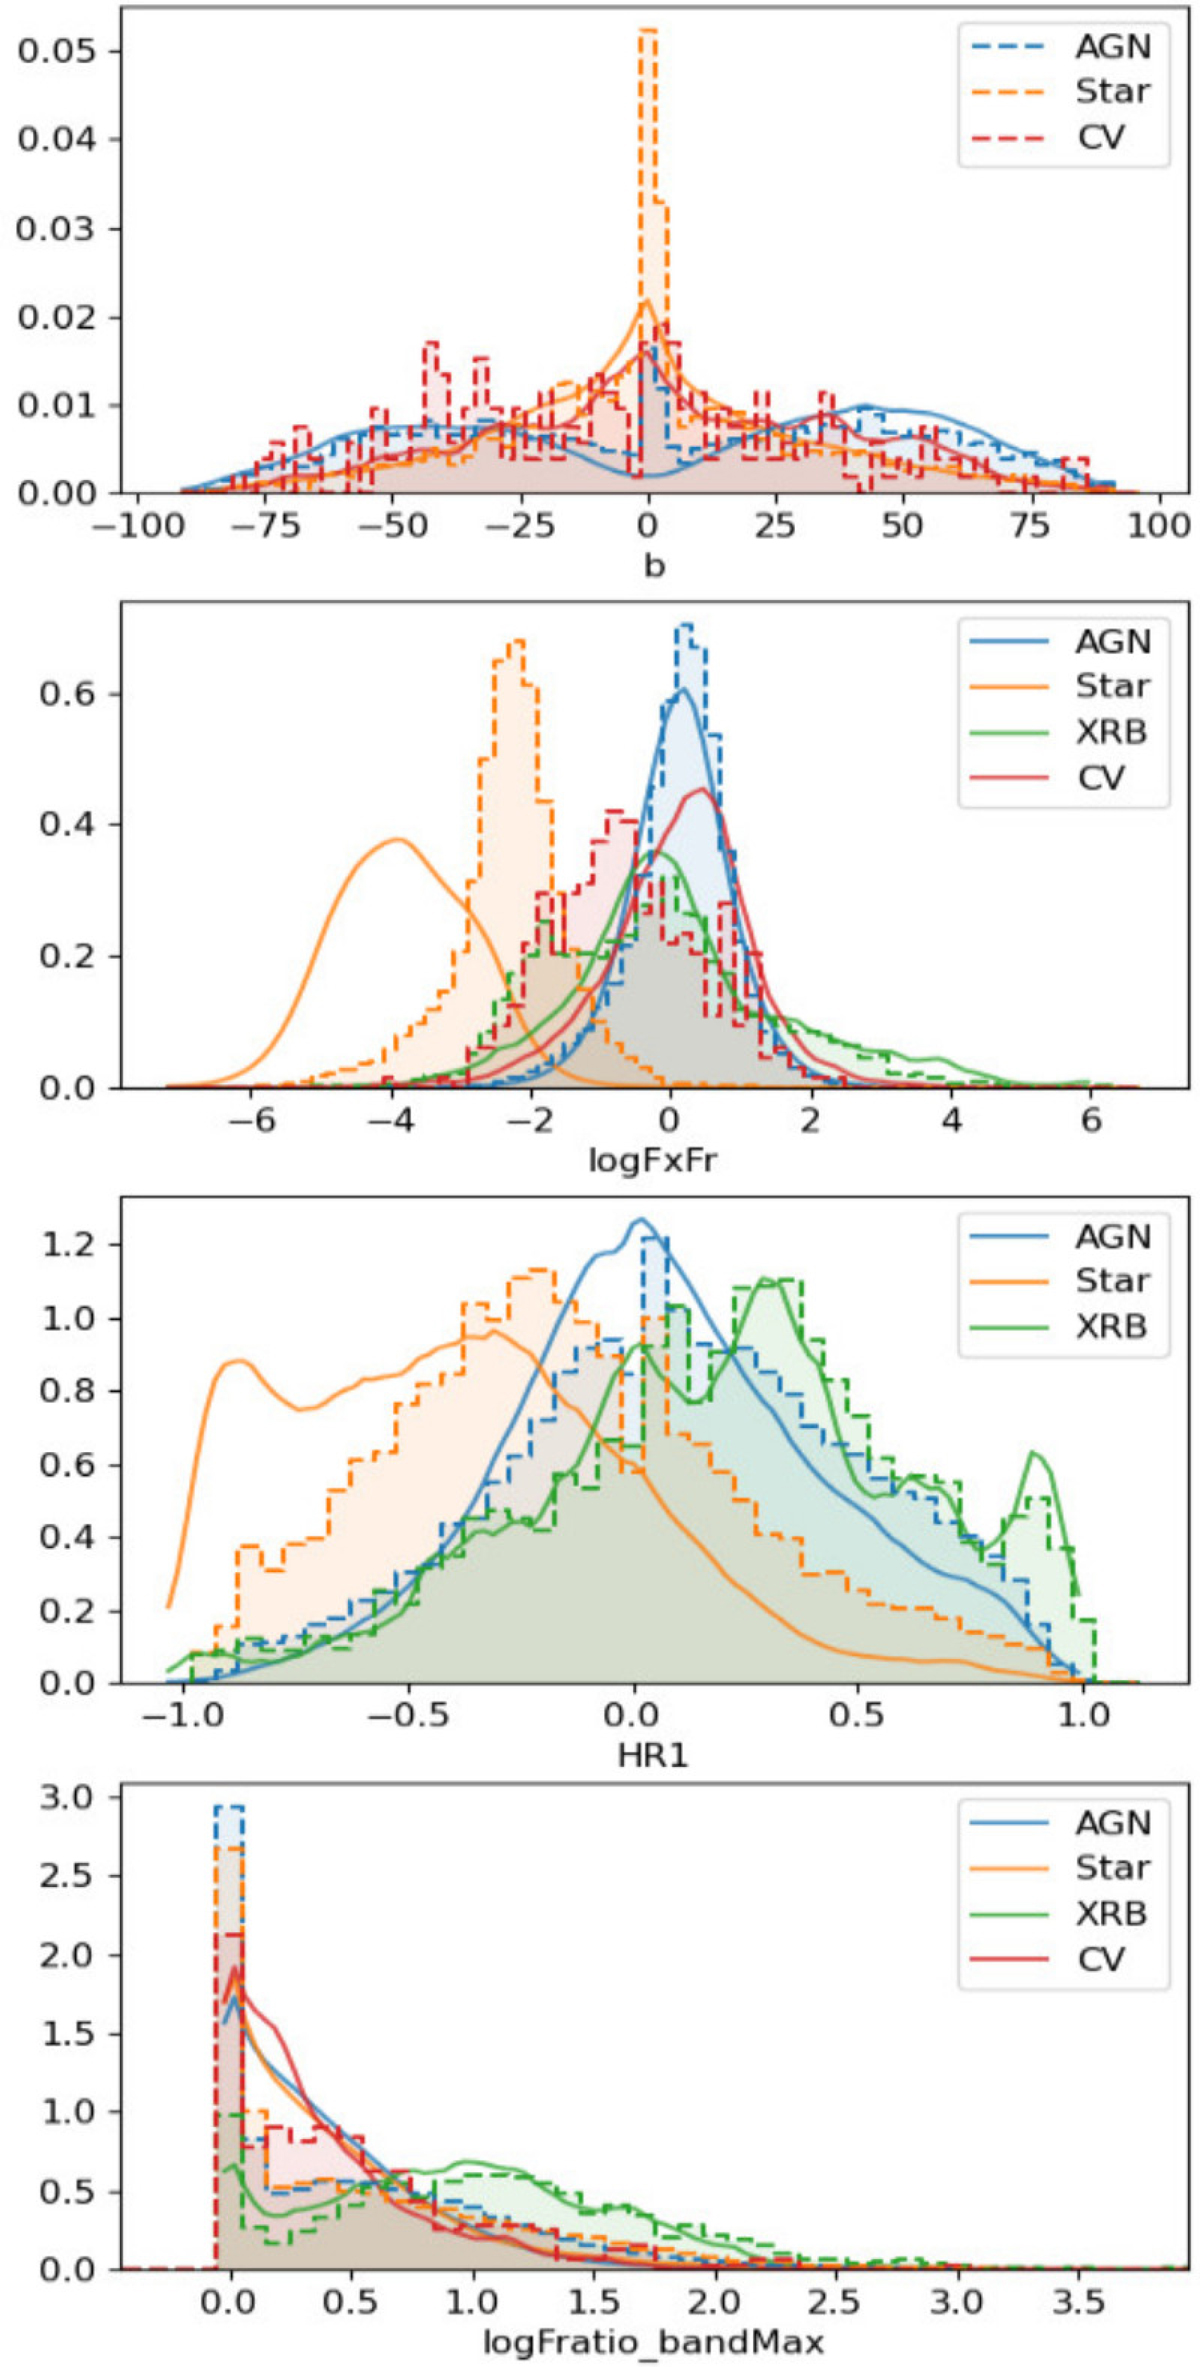
Download original image
Comparisons between the distributions of different properties in the test sample and their KDE (solid line). From top to bottom: galactic latitude (b), X-ray to r-band flux ratio (log10(FX/Fr)), hardness ratio between soft and medium X-ray bands (HR1), and logarithm of the max over mean flux ratio in the most variable XRT band (logFratioSnap). The y axis is in arbitrary units. In the first and third panels, only three classes are shown, to ease the graph readability. The b distribution of XRBs resembles a very sharp peak at 0° and some tails that look like the CV distribution. The HR1 distribution of CVs shows a good agreement with the KDE, which is shown in Fig. 2.
Current usage metrics show cumulative count of Article Views (full-text article views including HTML views, PDF and ePub downloads, according to the available data) and Abstracts Views on Vision4Press platform.
Data correspond to usage on the plateform after 2015. The current usage metrics is available 48-96 hours after online publication and is updated daily on week days.
Initial download of the metrics may take a while.