Open Access
Fig. 3.
Download original image
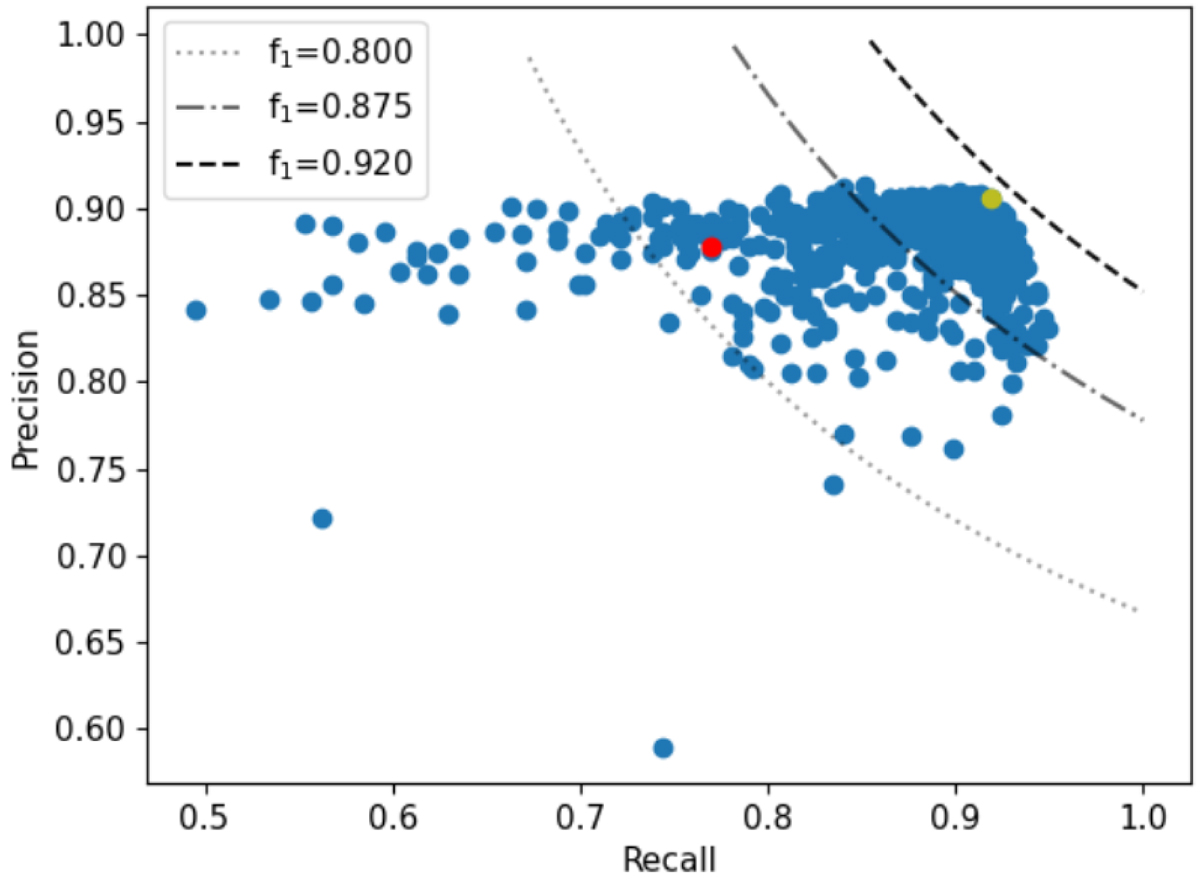
precision versus recall of the classification run at each iteration of the differential evolution algorithm. Contours of the f1 score are shown for reference. The algorithm converges to the point closer to the contour f1 = 0.92. The red and green dots correspond to the first and last iterations, respectively.
Current usage metrics show cumulative count of Article Views (full-text article views including HTML views, PDF and ePub downloads, according to the available data) and Abstracts Views on Vision4Press platform.
Data correspond to usage on the plateform after 2015. The current usage metrics is available 48-96 hours after online publication and is updated daily on week days.
Initial download of the metrics may take a while.