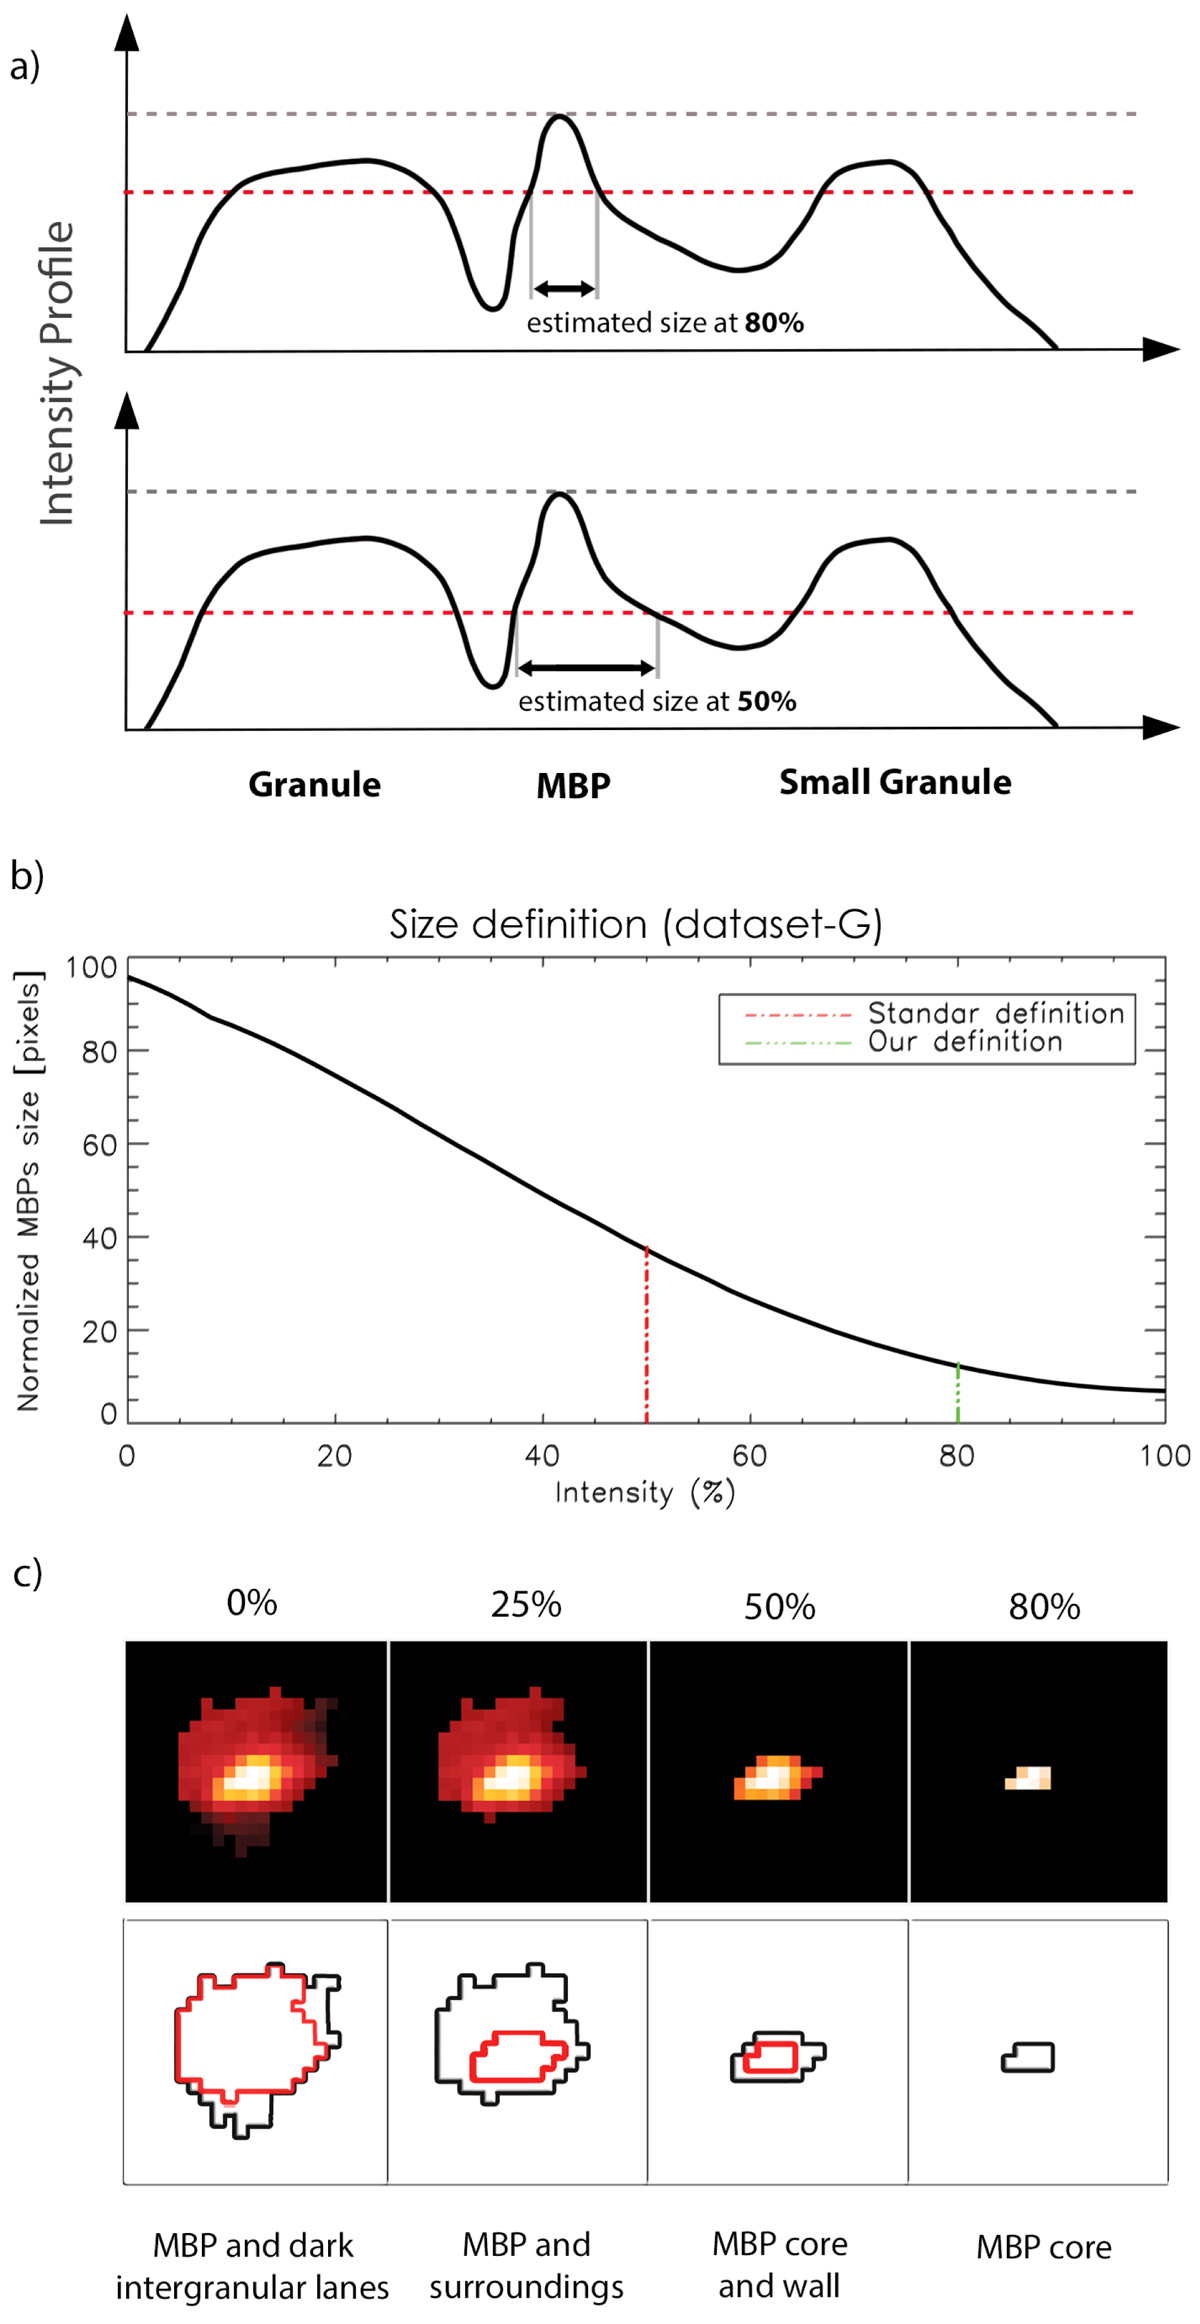
Fig. 6.
Download original image
Intensity characterisation of MBPs. Panel a: schematic side view cut of the solar surface in intensity with two granules and a MBP. The dashed horizontal line illustrates the cutting level and the following size of a segmented MBP. Panel b: criteria for setting the area of a MBP. The concept that underlies this criterion is based on finding a range of independence between the size of the MBP and the intensity cut-off percentage. Panel c: intensity thresholding (for values of 0, 25, 50 and 80%) applied over a segmented sample image and the effect on the identification of features, as labeled. The lower row represents contours in black for each frame in the upper row, and in red for every corresponding frame on the right, in order to compare the progressive area enlargement as the intensity threshold reduces from 80 to 0%. For exhaustive discussion refer to the main text.
Current usage metrics show cumulative count of Article Views (full-text article views including HTML views, PDF and ePub downloads, according to the available data) and Abstracts Views on Vision4Press platform.
Data correspond to usage on the plateform after 2015. The current usage metrics is available 48-96 hours after online publication and is updated daily on week days.
Initial download of the metrics may take a while.