Fig. 3.
Download original image
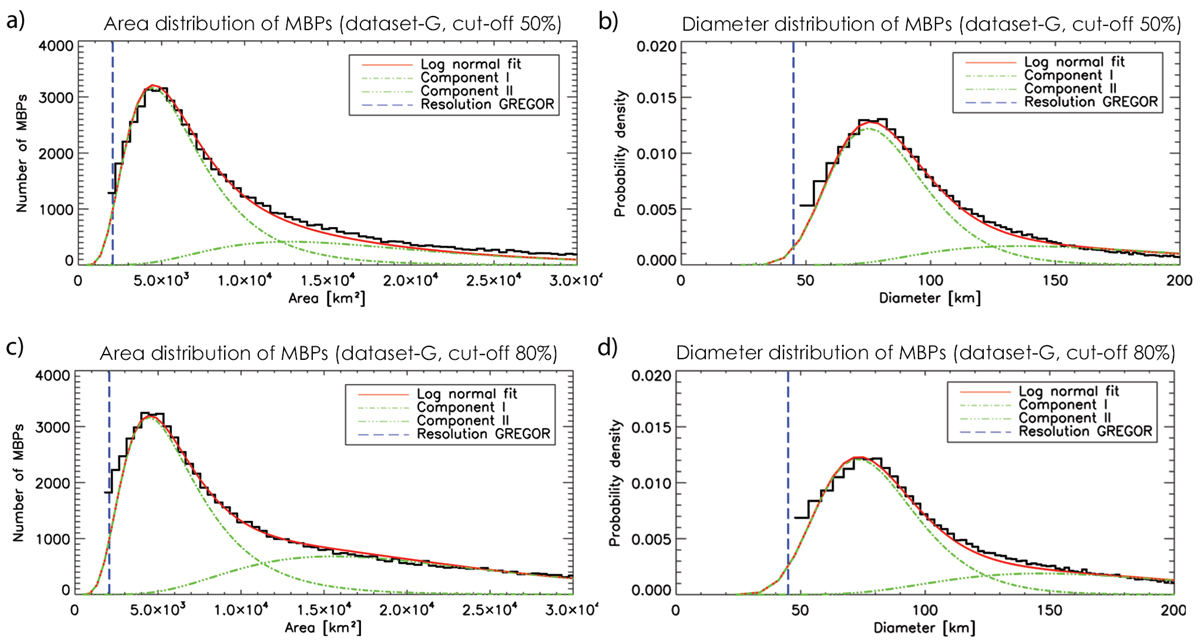
Area distributions (panels a,c) and diameter distributions (panels b,d). Both cases are shown for the dataset-G with cut-off of 50% (panels a,b) and 80% (panels c,d). The plots depict a distribution with a log normal fit (red curves) and the two components (green curves). The blue vertical line around 2000 km2 (45 km) for area (diameter) indicates the spatial resolution by diffraction of GREGOR.
Current usage metrics show cumulative count of Article Views (full-text article views including HTML views, PDF and ePub downloads, according to the available data) and Abstracts Views on Vision4Press platform.
Data correspond to usage on the plateform after 2015. The current usage metrics is available 48-96 hours after online publication and is updated daily on week days.
Initial download of the metrics may take a while.