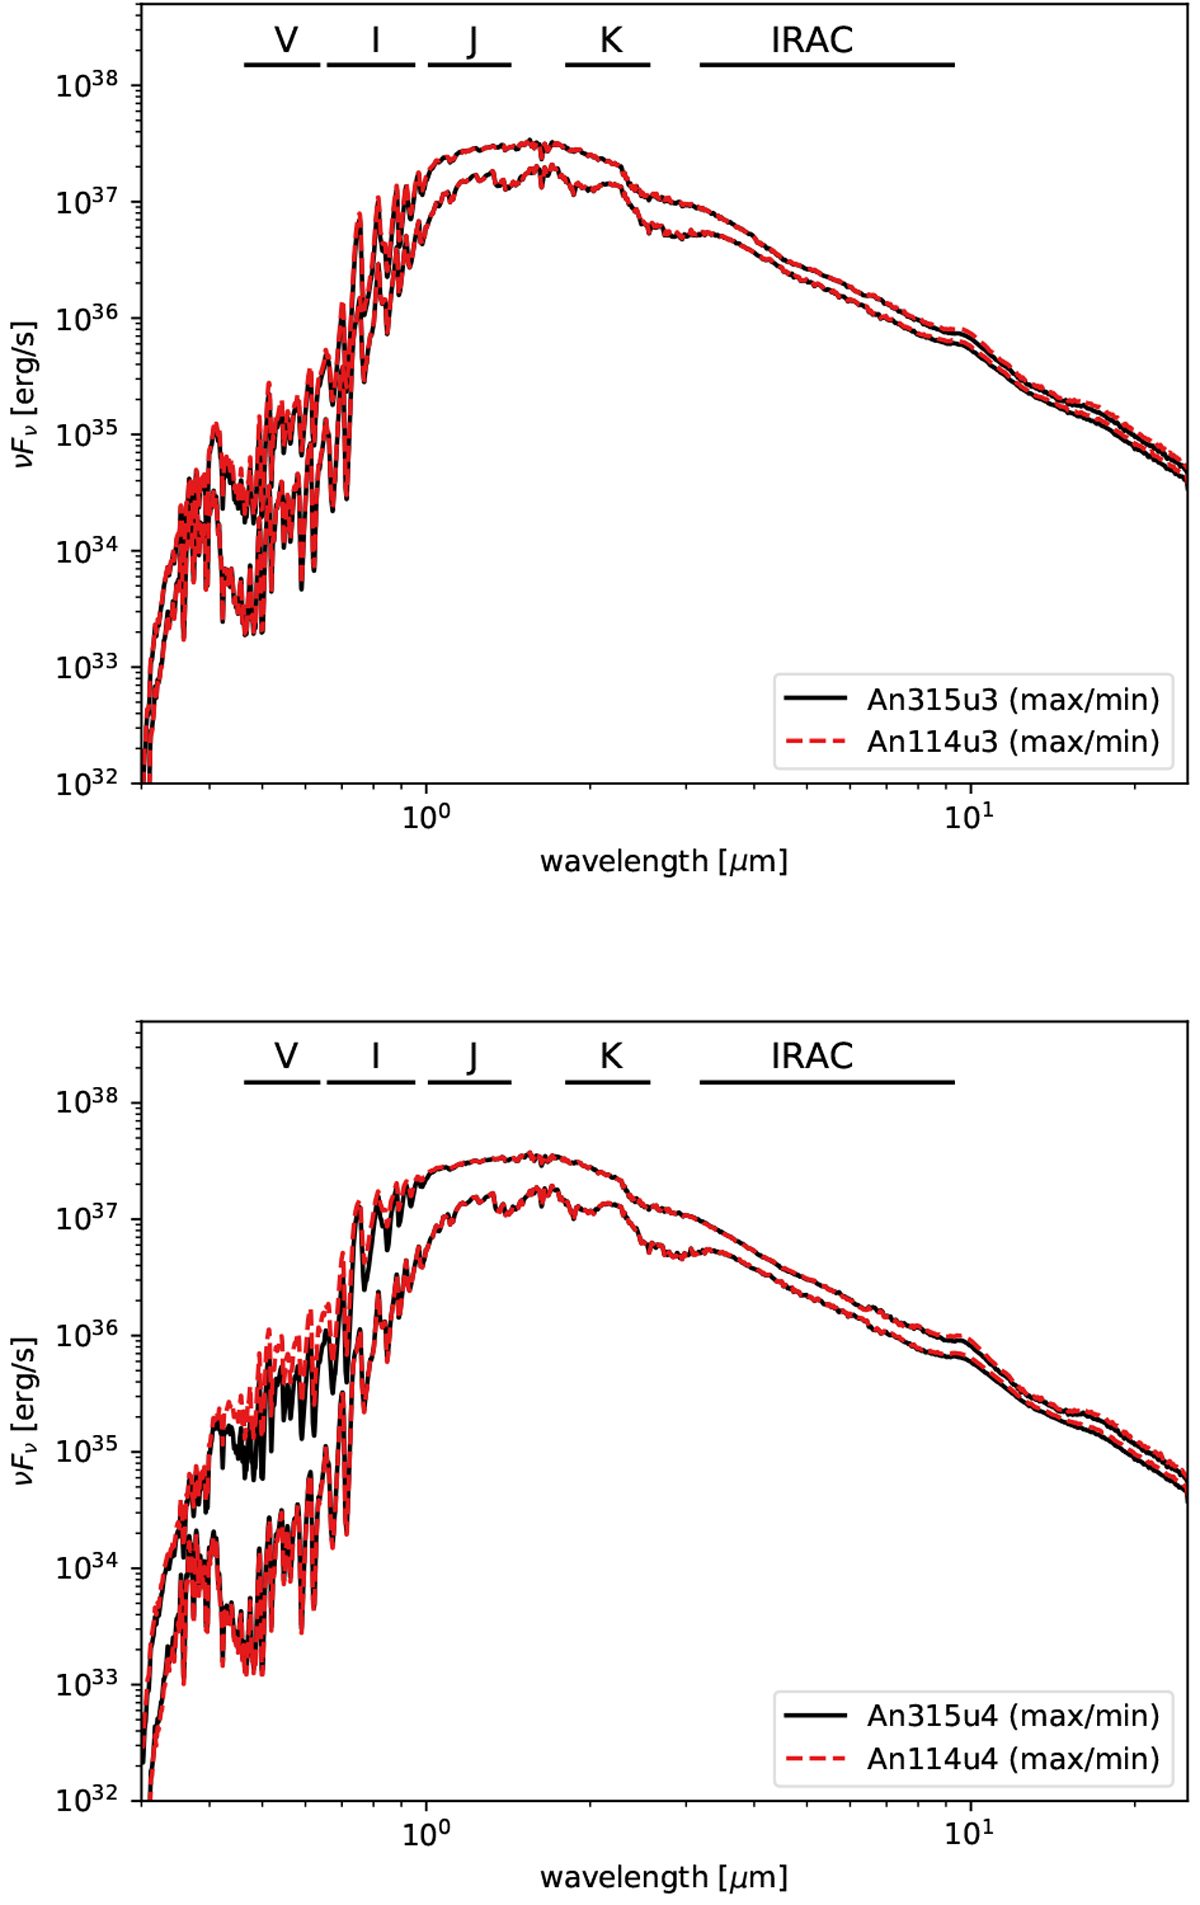
Fig. 7
Download original image
Spectral energy distributions of selected models from series A (see Table 1). Each panel shows SEDs at maximum and minimum light for two models that differ by seed particle abundance only (indicated by line style and color) to illustrate the effect of this parameter. The upper and lower panels, on the other hand, present models with different pulsation amplitudes but otherwise identical parameters. As expected, the models with higher pulsation amplitude (lower panel) show larger spectral variations between maximum and minimum.
Current usage metrics show cumulative count of Article Views (full-text article views including HTML views, PDF and ePub downloads, according to the available data) and Abstracts Views on Vision4Press platform.
Data correspond to usage on the plateform after 2015. The current usage metrics is available 48-96 hours after online publication and is updated daily on week days.
Initial download of the metrics may take a while.