Fig. 5
Download original image
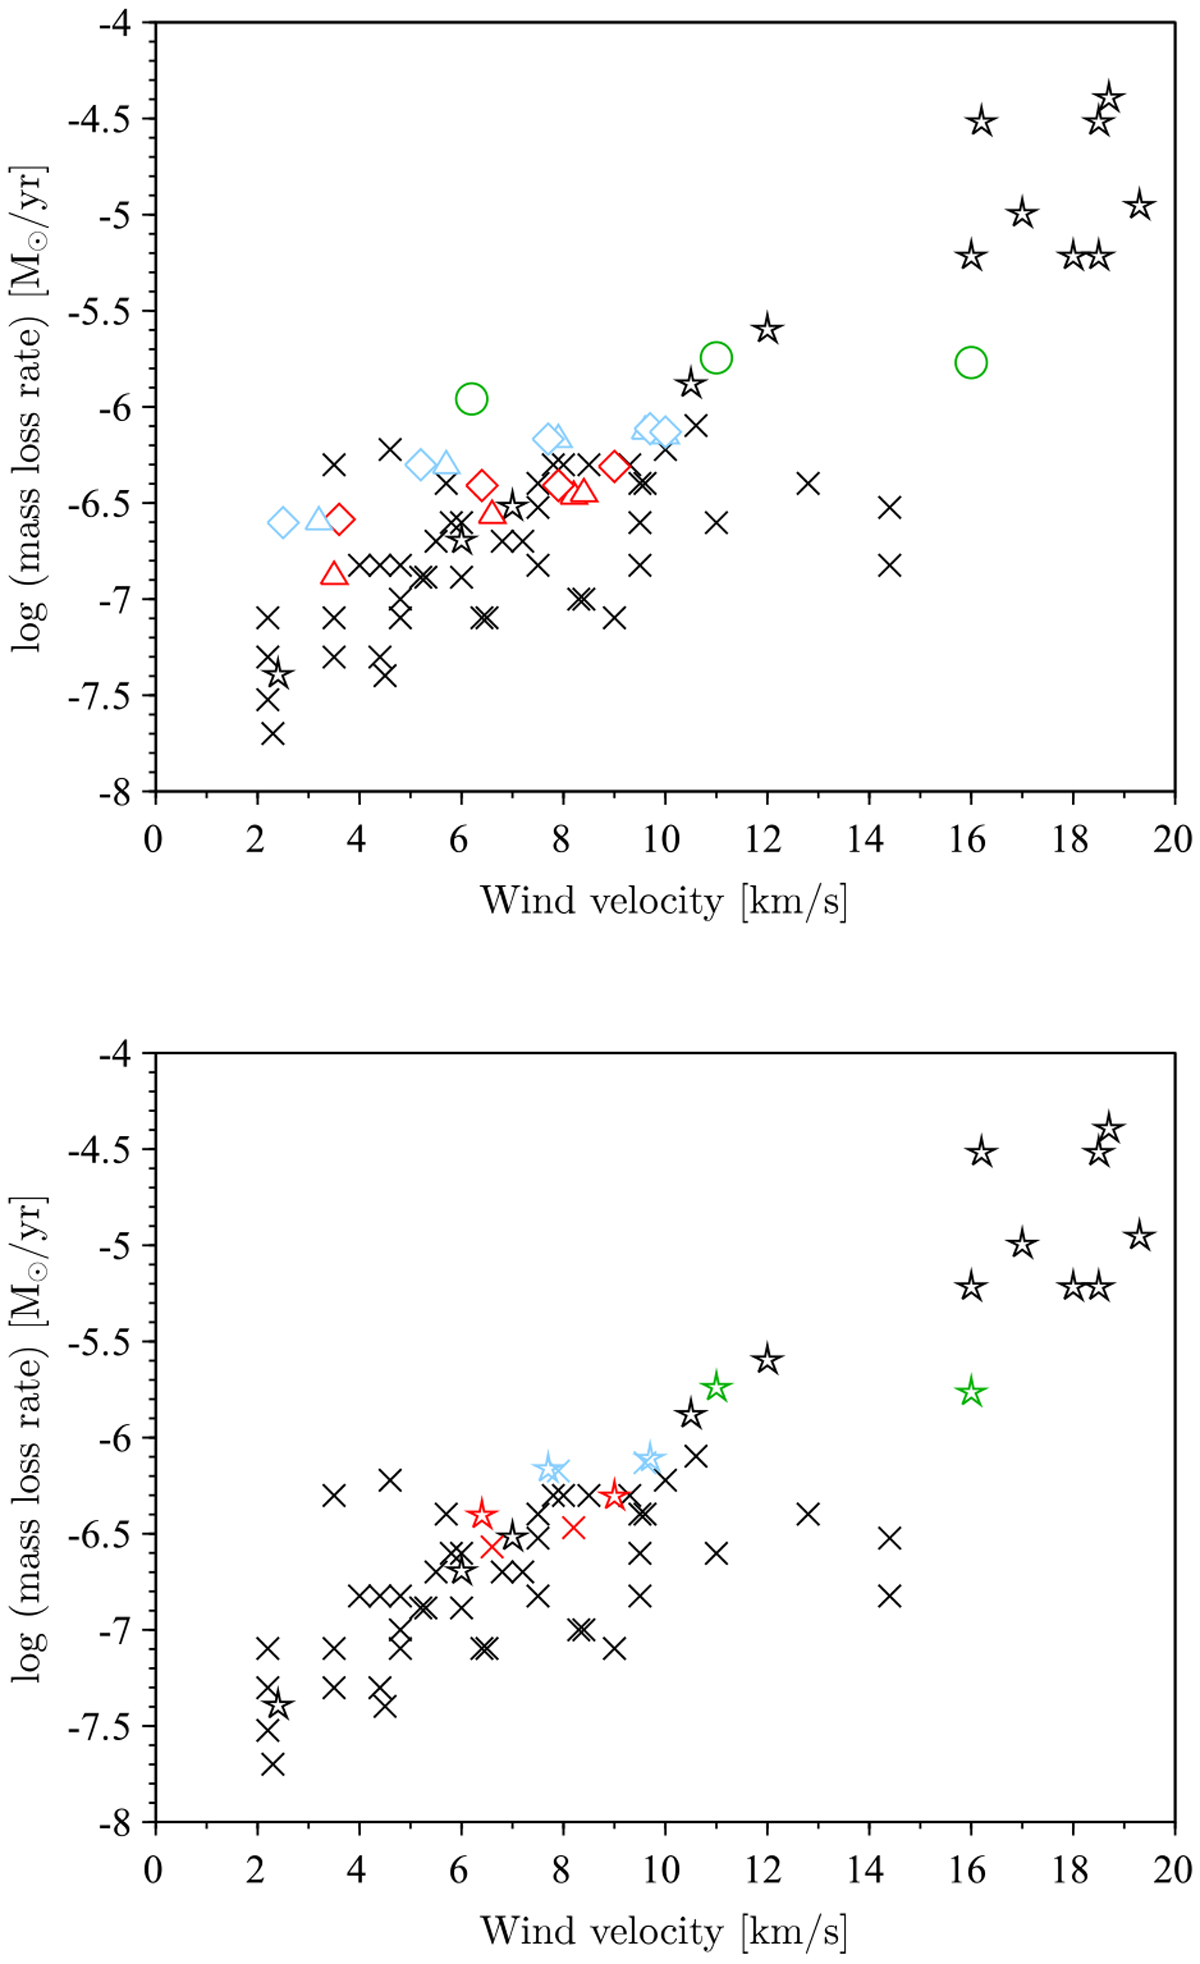
Mass-loss rate versus wind velocity for M-type AGB stars. Observations by Olofsson et al. (2002) and González Delgado et al. (2003) are shown in black (star symbols represent Mira variables, and crosses represent semi-regulars, SRa and SRb); colored symbols represent DARWIN models. Top panel: all models in Table 1 shown, with symbols indicating input parameters. Red symbols mark models of series A and blue symbols models of series B (triangles and diamonds indicate pulsation amplitudes of 3 and 4 km s−1, respectively); models of series M2 are shown as green circles. Bottom panel: selected models, discussed in Sect. 3.3 (see also Table 3). Symbol shapes indicate variability type (same as observations); red symbols represent series A, blue symbols series B, and green symbols series M2.
Current usage metrics show cumulative count of Article Views (full-text article views including HTML views, PDF and ePub downloads, according to the available data) and Abstracts Views on Vision4Press platform.
Data correspond to usage on the plateform after 2015. The current usage metrics is available 48-96 hours after online publication and is updated daily on week days.
Initial download of the metrics may take a while.