Free Access
Fig. 4
Download original image
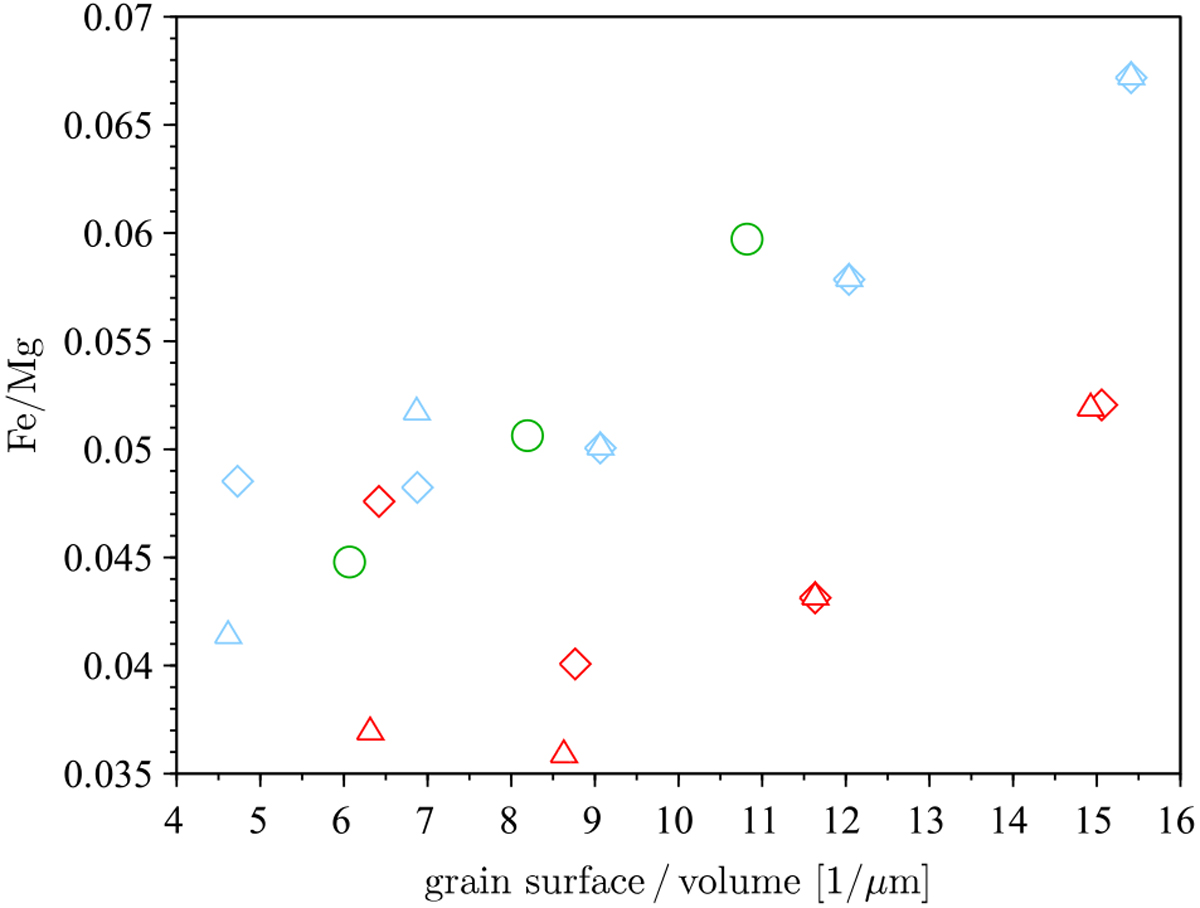
Fe/Mg versus surface/volume ratio of the grains. Red symbols mark models of series A and blue symbols models of series B (triangles and diamonds indicate pulsation amplitudes of 3 and 4 km s−1, respectively); models of series M2 are shown as green circles (see Table 1 for details).
Current usage metrics show cumulative count of Article Views (full-text article views including HTML views, PDF and ePub downloads, according to the available data) and Abstracts Views on Vision4Press platform.
Data correspond to usage on the plateform after 2015. The current usage metrics is available 48-96 hours after online publication and is updated daily on week days.
Initial download of the metrics may take a while.