Fig. 2
Download original image
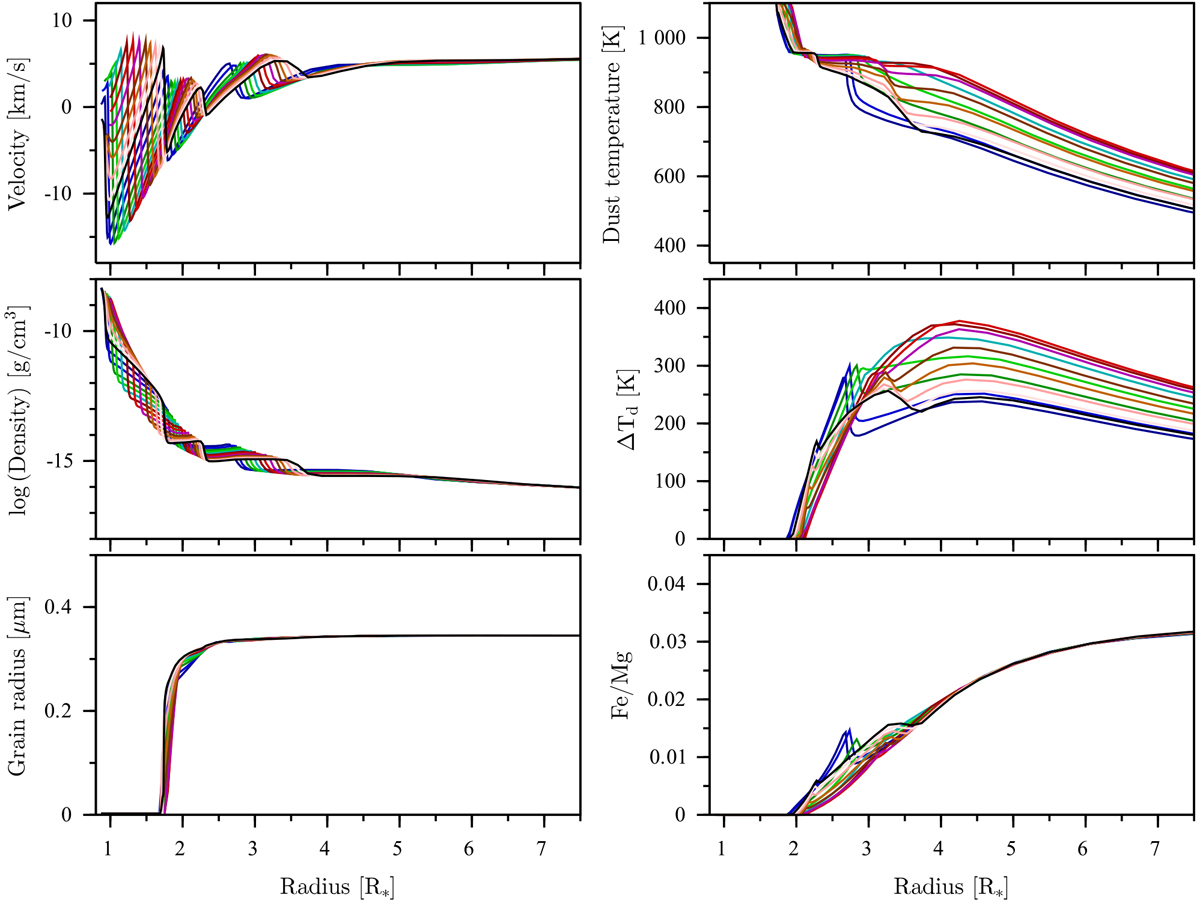
Time-dependent radial structure of model An315u3, zoomed in on the dust formation region (snapshots of 13 phases during a pulsation cycle). Left, top to bottom: flow velocity, gas density, grain radius. Right, top to bottom: temperature of the Fe-bearing silicate grains, difference in grain temperature with and without Fe, and the Fe/Mg ratio in the dust grains; see text for details. The first snapshot, shown in dark blue, corresponds to a near-minimum phase, green colors represent the ascending part of the bolometric light curve, the red curves show phases close to the luminosity maximum, and the remaining colors represent the descending part of the bolometric light curve, ending with the black curve. It should be noted that only the innermost, dust-free parts of the model structures show periodic variations that repeat every pulsation cycle (with the final black curve close to the initial dark blue curve in the velocity and density plots), while grain growth and wind acceleration are governed by other timescales.
Current usage metrics show cumulative count of Article Views (full-text article views including HTML views, PDF and ePub downloads, according to the available data) and Abstracts Views on Vision4Press platform.
Data correspond to usage on the plateform after 2015. The current usage metrics is available 48-96 hours after online publication and is updated daily on week days.
Initial download of the metrics may take a while.