Fig. A.1

Download original image
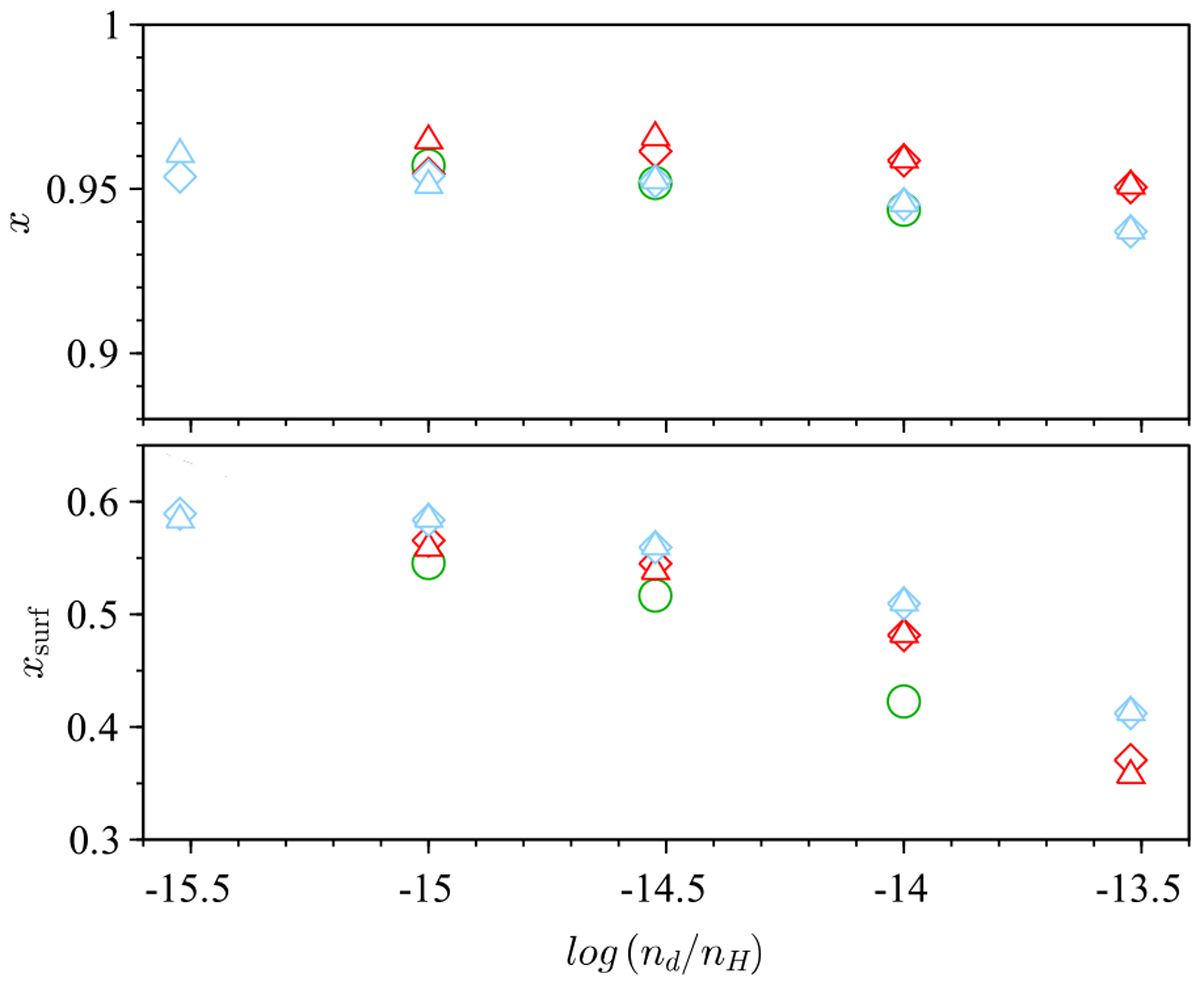
Composition of silicate grains in the DARWIN models. Upper panel: Total value
![]() for a grain, with Fe/Mg taken from Table 1. Lower panel: Estimated value at the grain surface xsurf as given by Eq. (A.3), using condensation degrees fMg and fMg from Table 1 in Eq. (A.2) for
for a grain, with Fe/Mg taken from Table 1. Lower panel: Estimated value at the grain surface xsurf as given by Eq. (A.3), using condensation degrees fMg and fMg from Table 1 in Eq. (A.2) for ![]() (to account for the depletion of Fe and Mg in the gas phase in the growth rates). In both panels, red symbols mark models of series A and blue symbols models of series B (triangles and diamonds indicate pulsation amplitudes of 3 and 4 km/s, respectively); models of series M2 are shown as green circles.
(to account for the depletion of Fe and Mg in the gas phase in the growth rates). In both panels, red symbols mark models of series A and blue symbols models of series B (triangles and diamonds indicate pulsation amplitudes of 3 and 4 km/s, respectively); models of series M2 are shown as green circles.
Current usage metrics show cumulative count of Article Views (full-text article views including HTML views, PDF and ePub downloads, according to the available data) and Abstracts Views on Vision4Press platform.
Data correspond to usage on the plateform after 2015. The current usage metrics is available 48-96 hours after online publication and is updated daily on week days.
Initial download of the metrics may take a while.


