Fig. 7
Download original image
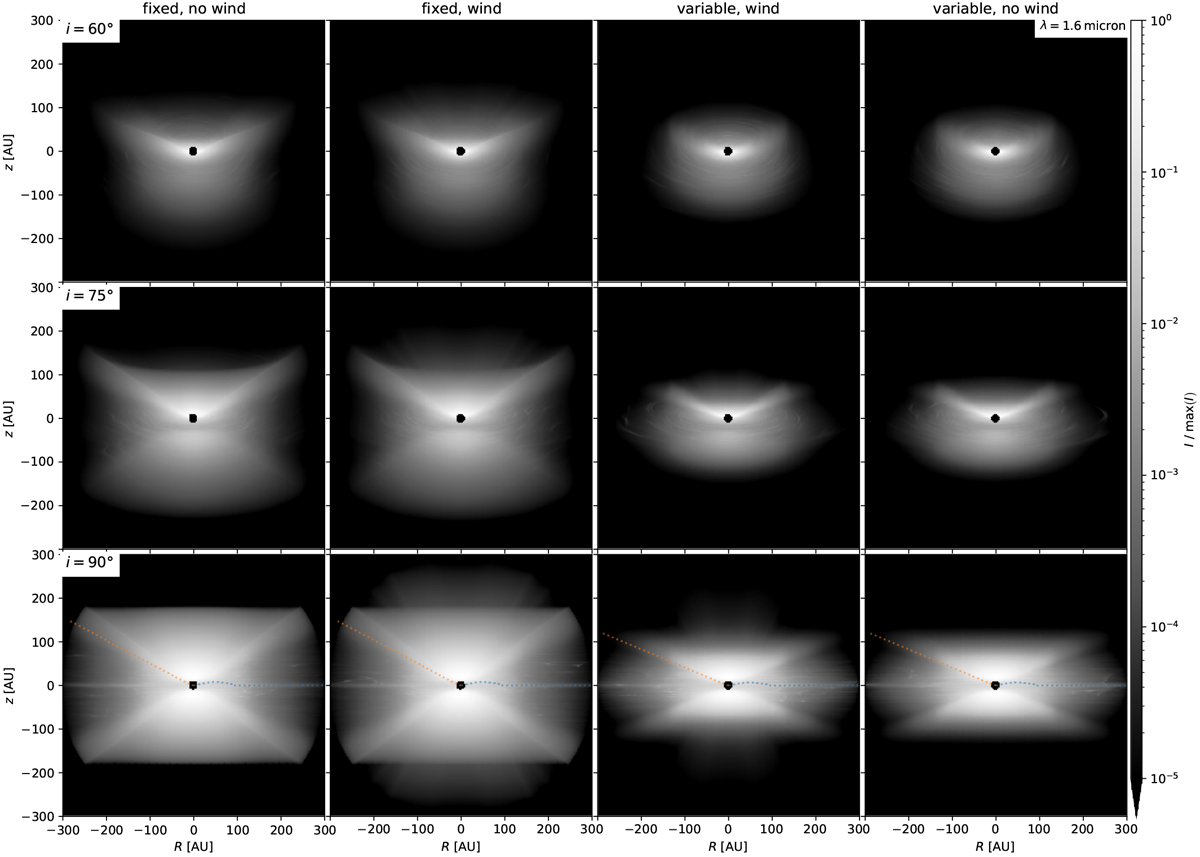
Radiative-transfer intensities for λobs = 1.6 μm. The max(I) for the logarithmic colour scale is taken for each plot individually, after application of an artificial coronagraph of radius 10 AU. The (τ = 1)-surfaces from r = 0 and z = ∞ are indicated by dotted orange and blue lines, respectively. Rows: inclinations
![]() , columns: results without (first and fourth) and with (second and third) dusty wind outflow; ‘fixed’ model on the left, ‘variable’ one on the right. The wind signature is most noticeable at high inclinations, revealing a chimney-like structure with a distinctly narrower opening angle than the disk surface; it remains clearly less bright than said disk surface. The ‘variable’ dust scale height yields a much fainter outflow signal.
, columns: results without (first and fourth) and with (second and third) dusty wind outflow; ‘fixed’ model on the left, ‘variable’ one on the right. The wind signature is most noticeable at high inclinations, revealing a chimney-like structure with a distinctly narrower opening angle than the disk surface; it remains clearly less bright than said disk surface. The ‘variable’ dust scale height yields a much fainter outflow signal.
Current usage metrics show cumulative count of Article Views (full-text article views including HTML views, PDF and ePub downloads, according to the available data) and Abstracts Views on Vision4Press platform.
Data correspond to usage on the plateform after 2015. The current usage metrics is available 48-96 hours after online publication and is updated daily on week days.
Initial download of the metrics may take a while.