Fig. 5
Download original image
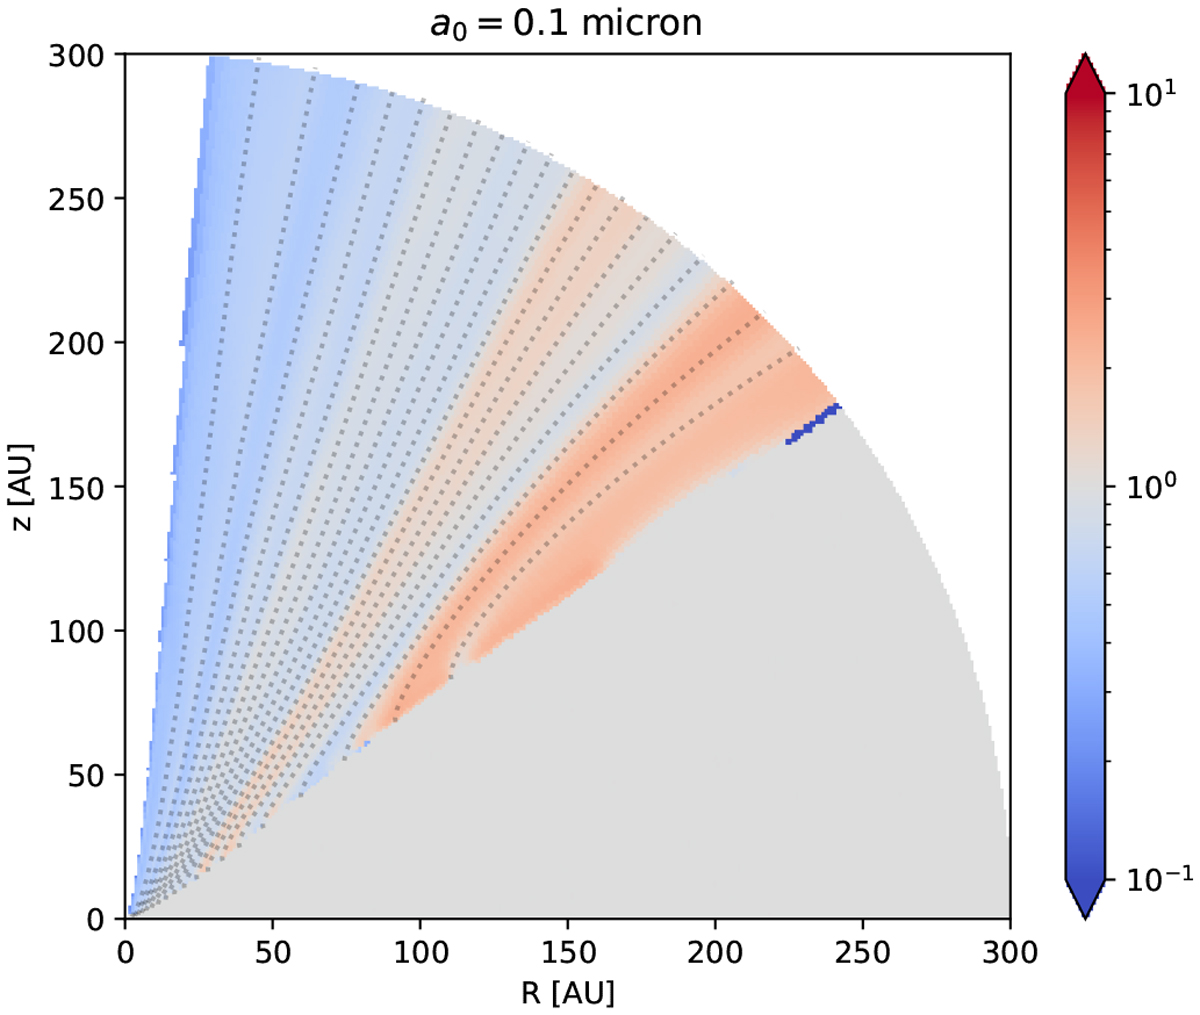
Ratio between gas density and dust density for a0 = 0.1 μm for the‘fixed’ model, normalised to the value in the disk for clarity. The density of this small, and hence well-coupled grain species closely follows the gas density. For comparison with the density variations in the dust, the gas streamlines (one per 5% Ṁgas) are added as dotted grey lines.
Current usage metrics show cumulative count of Article Views (full-text article views including HTML views, PDF and ePub downloads, according to the available data) and Abstracts Views on Vision4Press platform.
Data correspond to usage on the plateform after 2015. The current usage metrics is available 48-96 hours after online publication and is updated daily on week days.
Initial download of the metrics may take a while.