Free Access
Fig. 11
Download original image
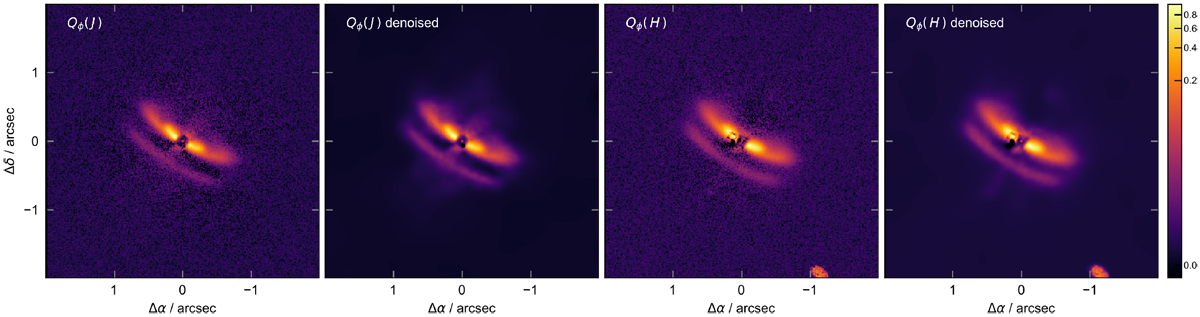
Qϕ images of MY Lup in J- and H-band, based on a new reduction of the data presented in Avenhaus et al. (2018). For both bands, the images are shown without and with smoothing by a denoising algorithm (Price 2007). There is a faint signal from the minor axis of the disk, which hints at a dusty outflow.
Current usage metrics show cumulative count of Article Views (full-text article views including HTML views, PDF and ePub downloads, according to the available data) and Abstracts Views on Vision4Press platform.
Data correspond to usage on the plateform after 2015. The current usage metrics is available 48-96 hours after online publication and is updated daily on week days.
Initial download of the metrics may take a while.