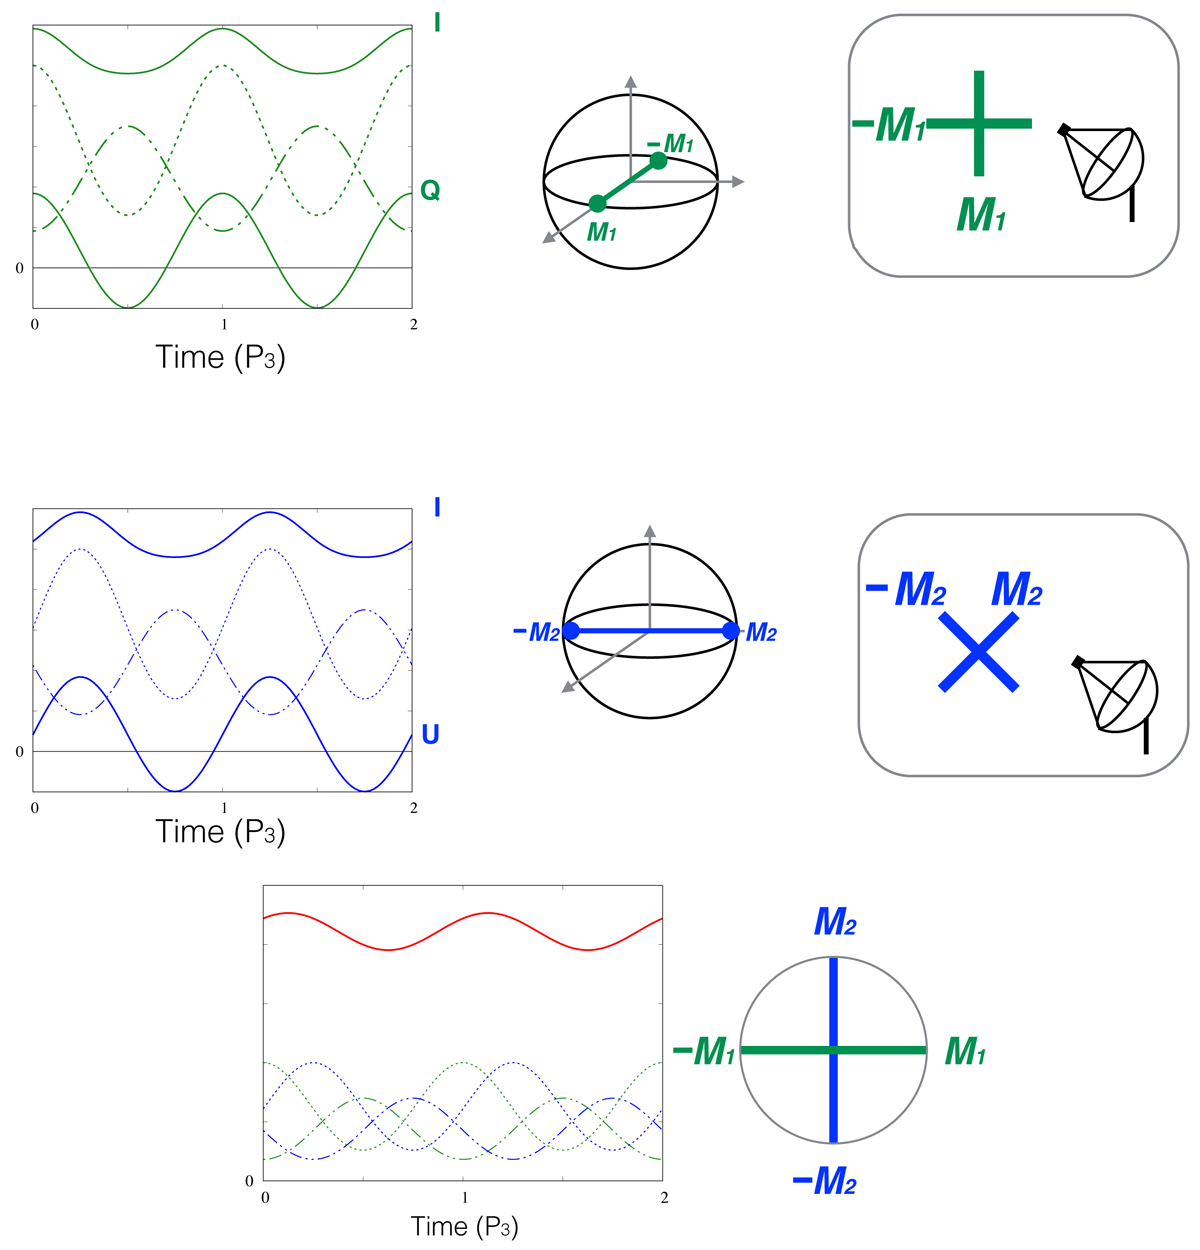
Fig. A.3.
Download original image
Four-mode mixing model. Top row: signal from emission region ℳ1; middle row: signal from emission region ℳ2; and bottom row: incoherent superposition of ℳ1 and ℳ2. Upper two rows: from right to left, the right-most panels depict the OPM pairs as linearly polarised states in the x − y plane orthogonal to the line of sight of the antenna; the middle panels depict the OPM pairs in the Poincaré sphere; and the left-most panels depict the modulated time series produced by the OPM pairs over two drift cycles, where the dashed lines represent the positive OPM state, the dash-dot lines represent the negative OPM state, the upper thick lines represent the total intensity, and the lower thick lines represent the superposed polarisation state. Bottom row: the right panel depicts the four modes in the equatorial plane of the Poincaré sphere and the left panel depicts the modulated time series produced by the incoherent superposition the OPM pairs over two drift cycles (colours and line types are the same as for the upper two rows, and the resultant total intensity is shown in red.
Current usage metrics show cumulative count of Article Views (full-text article views including HTML views, PDF and ePub downloads, according to the available data) and Abstracts Views on Vision4Press platform.
Data correspond to usage on the plateform after 2015. The current usage metrics is available 48-96 hours after online publication and is updated daily on week days.
Initial download of the metrics may take a while.