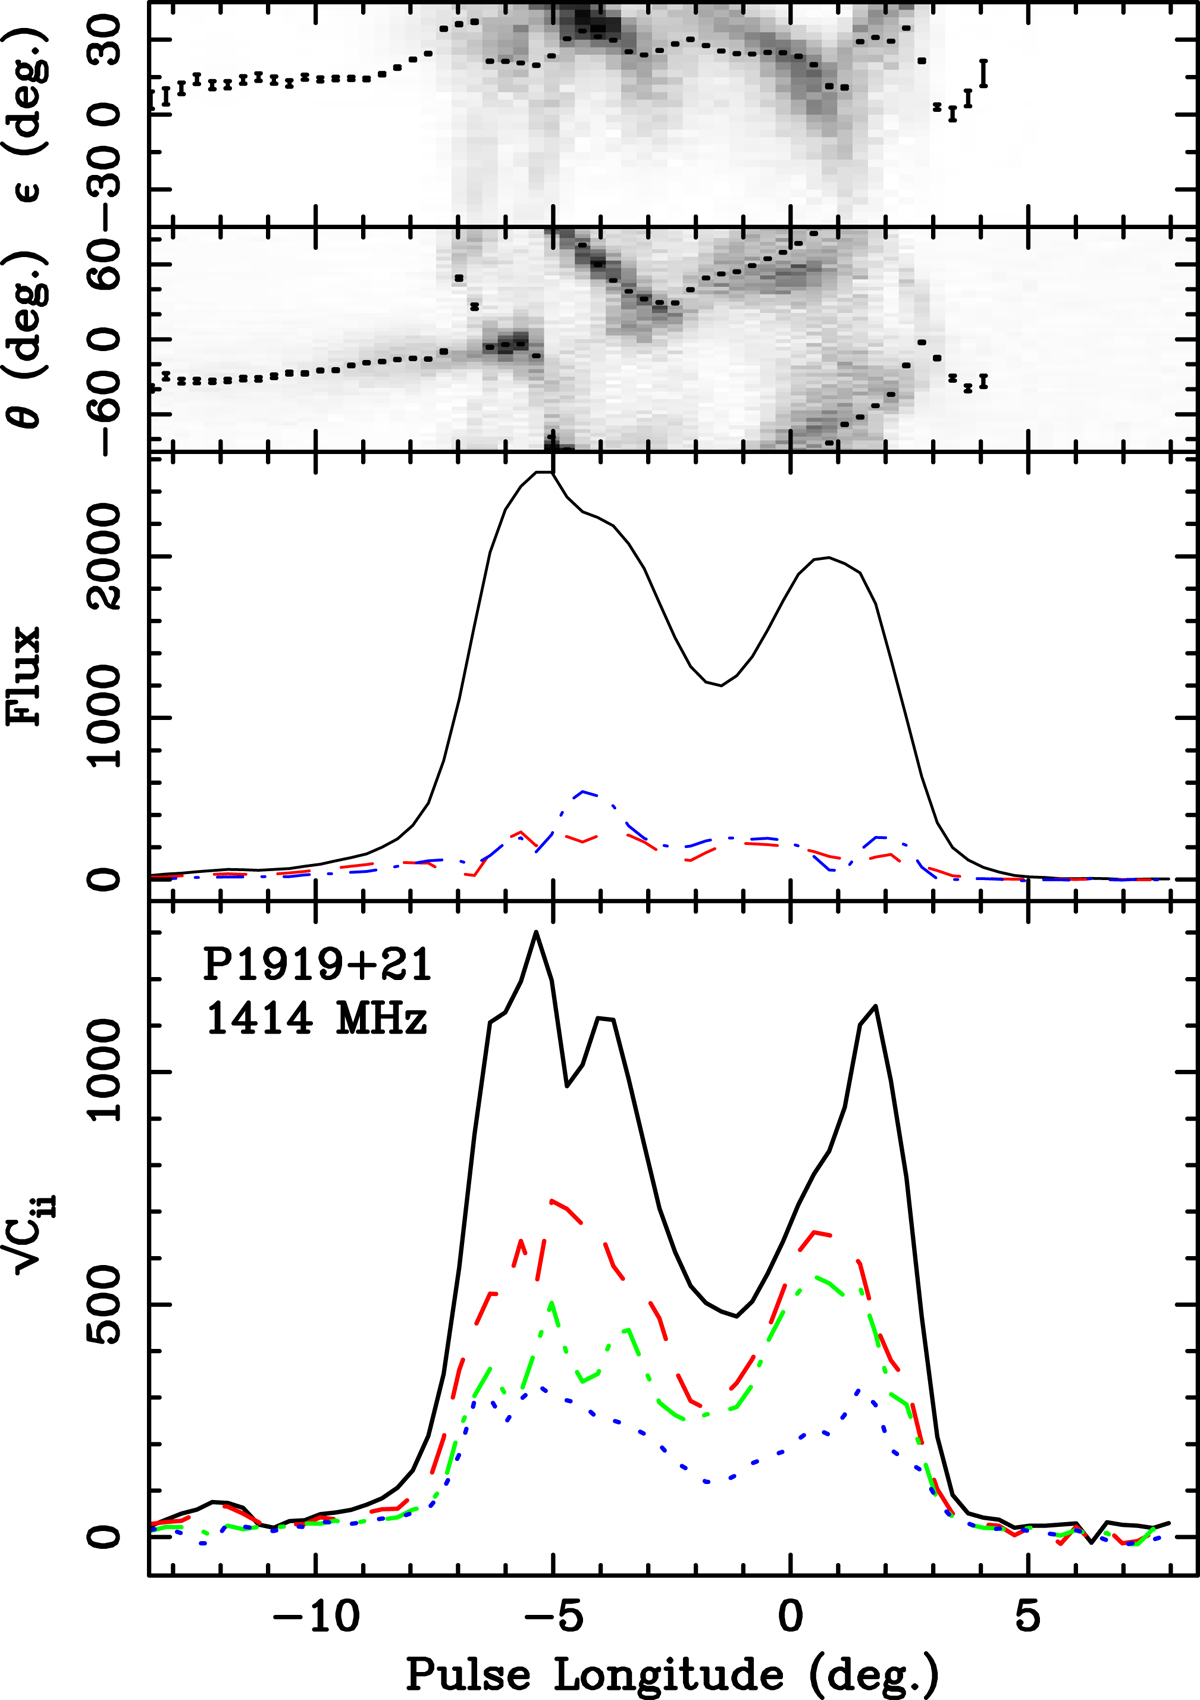
Fig. 1.
Download original image
Longitude-resolved mean and variability of the polarised emission from PSR B1919+21 at 1414 MHz. Panel a: both the ellipticity angle of the average Stokes parameters (points with error bars) and a histogram of the ellipticity angles of the individual pulses (greyscale intensity). Similarly, panel b: both the position angle of the average Stokes parameters and a histogram of the position angles of the individual pulses. Panel c: integrated profile in total intensity (black, upper solid), linear (red, dashed) and circular polarisation (blue, dot-dashed). These profiles were obtained by averaging together all the available data. In panel d, the black solid line shows the standard deviation of the total intensity, and the red dashed, green dot-dashed, and blue dotted lines display the square roots of the eigenvalues (from largest to smallest, respectively) of the 3 × 3 partition of the covariance matrix that describes the fluctuations of the polarisation vector S = (Q, U, V).
Current usage metrics show cumulative count of Article Views (full-text article views including HTML views, PDF and ePub downloads, according to the available data) and Abstracts Views on Vision4Press platform.
Data correspond to usage on the plateform after 2015. The current usage metrics is available 48-96 hours after online publication and is updated daily on week days.
Initial download of the metrics may take a while.