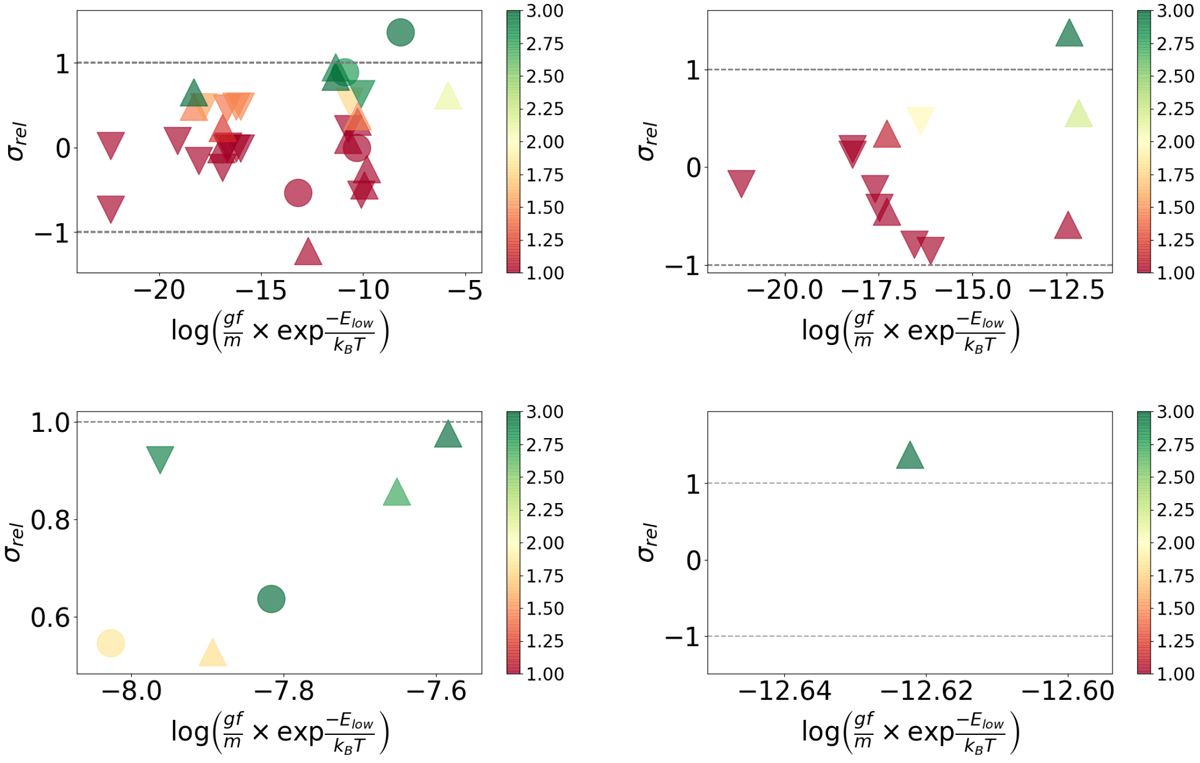
Fig. 5
Download original image
Element absorption in the 0.75 Å passband of all the transitions approved by QT, for selected elements in HD 209458b. (Upper left: Ca I, Upper right: Mn I, bottom left: Sc II, bottom right: V II). The ordinate shows (−CIO)∕Σnoise where Σnoise = max(ΣII, ΣOO). The color shows the detection significance (−CIO∕ΣIO), where green is ≥3σ and red is ≤1σ. Additionally, to deal with contamination from transitions of other species closer than 1 × FWHM, we show the ones without contamination as circles (•), with the strongest oscillator strength at that element as triangles pointing up (▴). Both types are considered strong transitions (ST). Otherwise, we show them as triangles pointing down (▾), and considered them as weak transitions.
Current usage metrics show cumulative count of Article Views (full-text article views including HTML views, PDF and ePub downloads, according to the available data) and Abstracts Views on Vision4Press platform.
Data correspond to usage on the plateform after 2015. The current usage metrics is available 48-96 hours after online publication and is updated daily on week days.
Initial download of the metrics may take a while.