Free Access
Fig. 4
Download original image
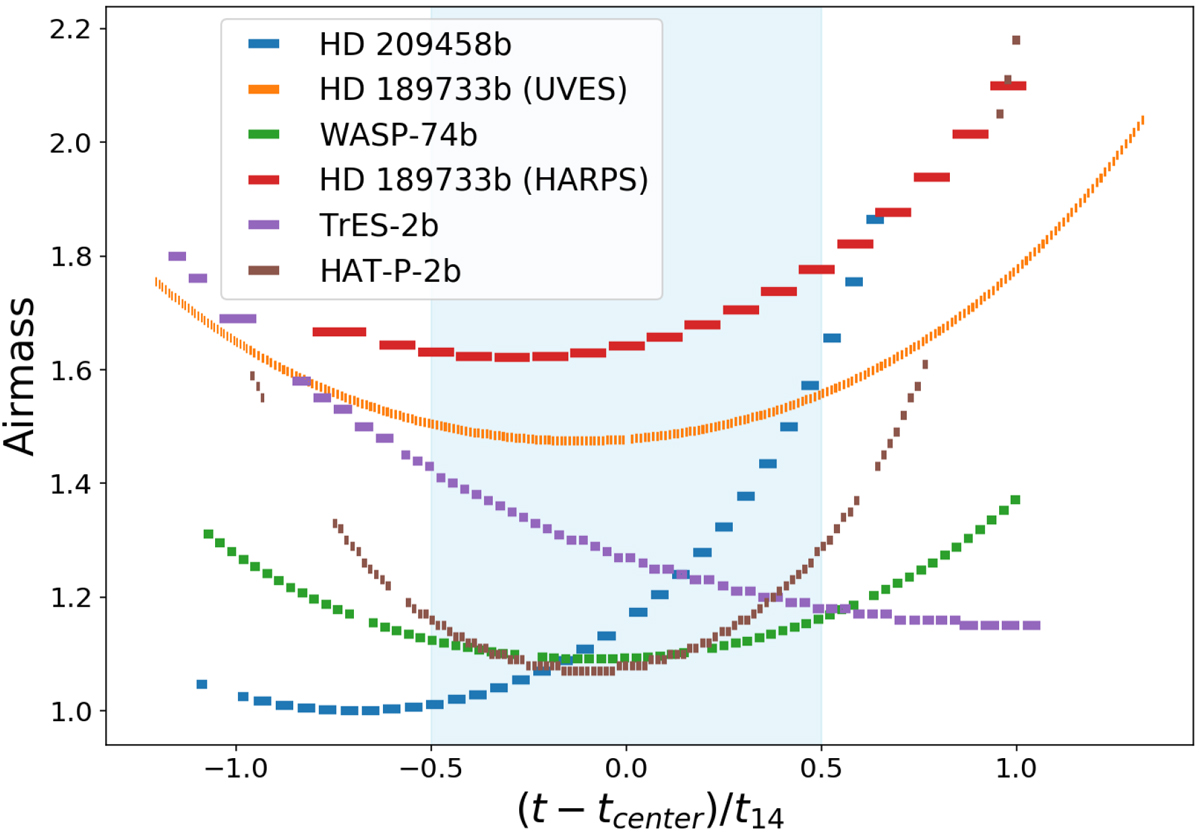
Transit coverage of all planets analyzed in this paper. Each line represents a frame, and the length of the line was calculated using the exposure time adopted at that frame. It is important to note the dispersion of exposure times. The transit duration is shown as a light blue band.
Current usage metrics show cumulative count of Article Views (full-text article views including HTML views, PDF and ePub downloads, according to the available data) and Abstracts Views on Vision4Press platform.
Data correspond to usage on the plateform after 2015. The current usage metrics is available 48-96 hours after online publication and is updated daily on week days.
Initial download of the metrics may take a while.