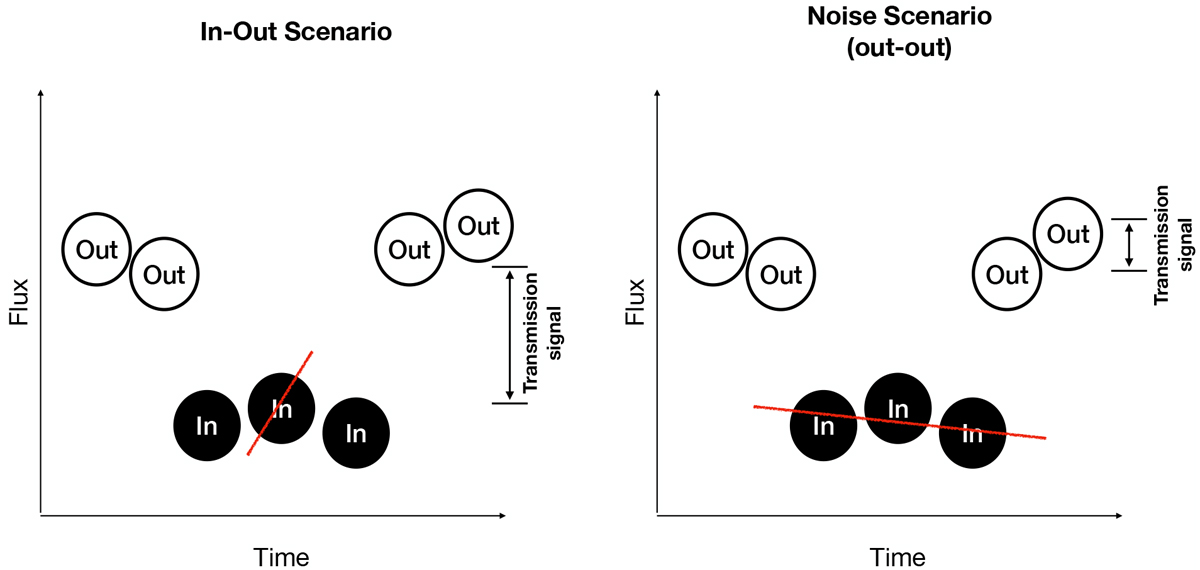
Fig. 3
Download original image
Graphical representation of our analysis along wavelength, using bootstrap scenarios adapted from Redfield et al. (2008). Left panel: The In-Out scenario: in order to avoid the situation where a few frames might be dominating the absorption, we removed an increasing number of in-transit frames at random to calculate the relative absorption (starting with two and ending at half of the sample). Right panels: Noise scenarios: for the Out-Out scenario, we ignored all the in-transit frames and labeled some of the remaining frames as in-transit to calculate the absorption. We did the same for the In-In scenario as the Out-Out one, but we ignored the out-transit frames. The distribution of the In-Out scenario is expected to be centered at the actual relative absorption, while noise scenarios should be centered at zero. We used the 1σ value of theIn-Out histogram as our uncertainty. Additionally, 3000 iterations of these scenarios were made for each transition. However, when the frames were scarce, we made the maximum number of iterations allowed without repeating possibilities.
Current usage metrics show cumulative count of Article Views (full-text article views including HTML views, PDF and ePub downloads, according to the available data) and Abstracts Views on Vision4Press platform.
Data correspond to usage on the plateform after 2015. The current usage metrics is available 48-96 hours after online publication and is updated daily on week days.
Initial download of the metrics may take a while.