Fig. 9
Download original image
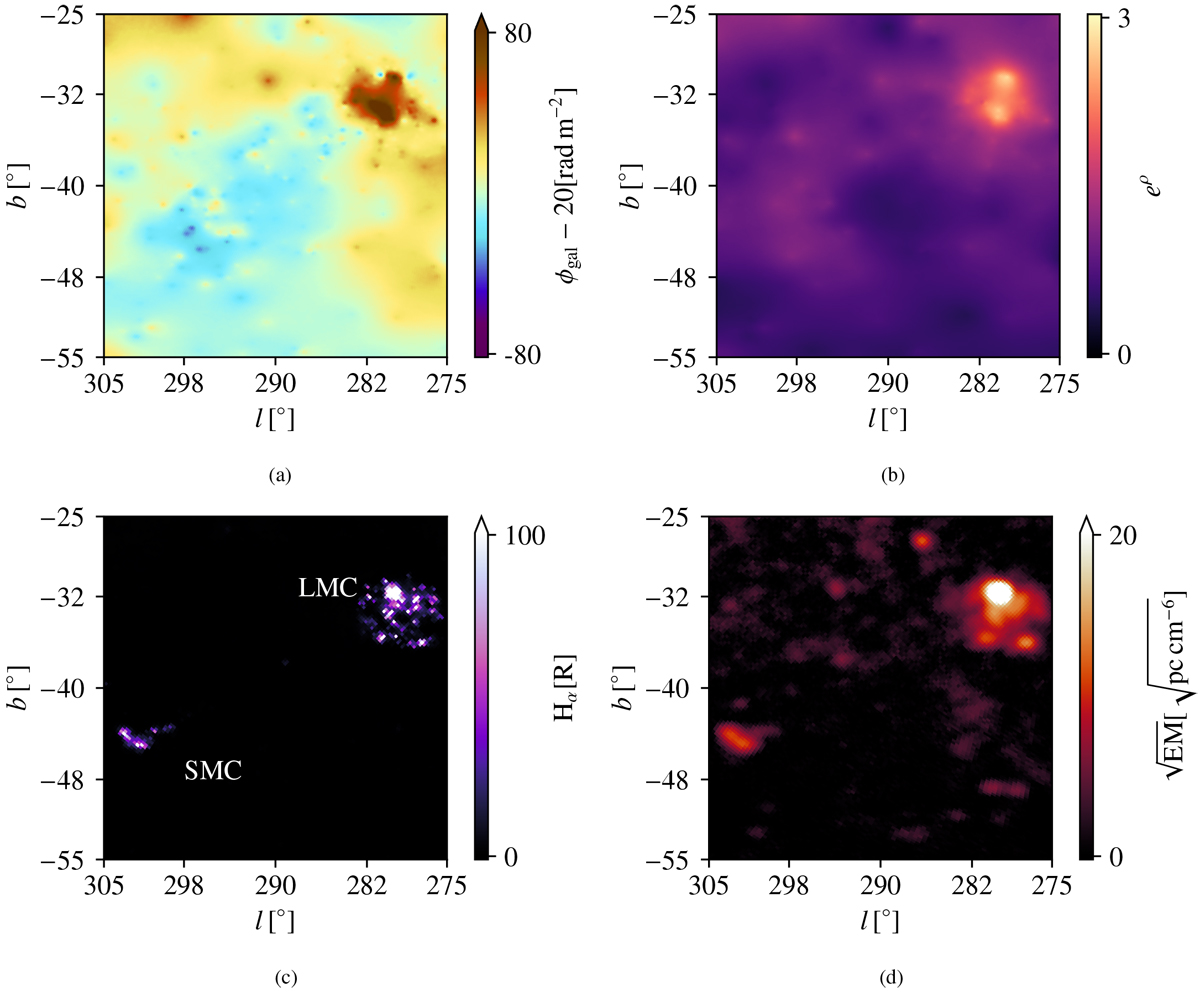
Magellanic Clouds in our results and as seen with different observables, respectively: panels a and b show the Faraday rotation (with a 20 rad m−2 offset) and the underlying amplitude field as inferred in this work. Panels c and d show the clouds in H α emission (Finkbeiner 2003; Gaustad et al. 2001), and in emission measure (EM), as obtained by the Planck satellite (Planck Collaboration X 2016), respectively. Panel c indicates the locations of the clouds.
Current usage metrics show cumulative count of Article Views (full-text article views including HTML views, PDF and ePub downloads, according to the available data) and Abstracts Views on Vision4Press platform.
Data correspond to usage on the plateform after 2015. The current usage metrics is available 48-96 hours after online publication and is updated daily on week days.
Initial download of the metrics may take a while.