Fig. 6
Download original image
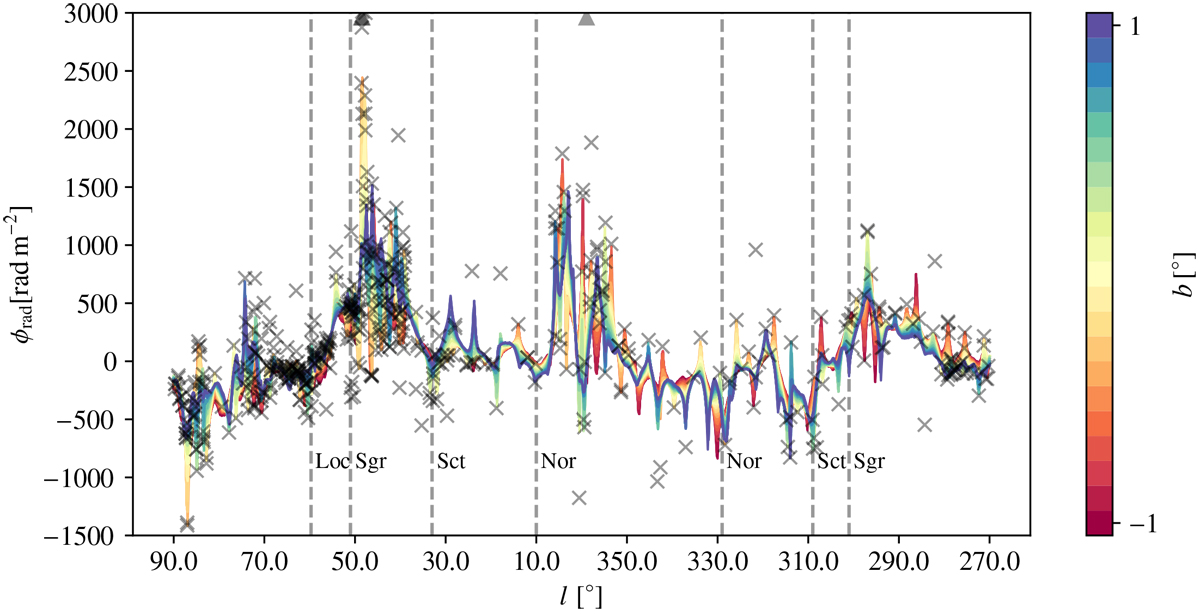
Slice in longitude (l ∈ (270°, 90°)) through the inner part of the Galactic disc from the Galactic Faraday rotation sky. The colored strips indicate equal latitude strips of the inferred Faraday sky within b ∈ (−1°, 1°). The plot also contains the data points falling in the same region indicated by grey crosses. Data points with ϕ > 3000 rad m−2 are indicated with black triangles at the upper end of the plot. The approximate locations of several spiral arm tangents (Hou et al. 2009; Vallée 2017) are indicated as grey lines, specifically these are the Local (Loc), Sagittarius (Sgr), Scrutum (Sct), and Norma (Nor) arms. We note that these positions are inferred from different tracers such as HII regions and hence do not necessarily coincide exactly with the tangent points traced by a potential excess in Faraday rotation. The region towards l ≈ 45° is also partly shown in Shanahan et al. (2019), where the strong excess in Faraday rotation in direction to the tangent of the Sagittarius arm was first noted.
Current usage metrics show cumulative count of Article Views (full-text article views including HTML views, PDF and ePub downloads, according to the available data) and Abstracts Views on Vision4Press platform.
Data correspond to usage on the plateform after 2015. The current usage metrics is available 48-96 hours after online publication and is updated daily on week days.
Initial download of the metrics may take a while.