Fig. 12
Download original image
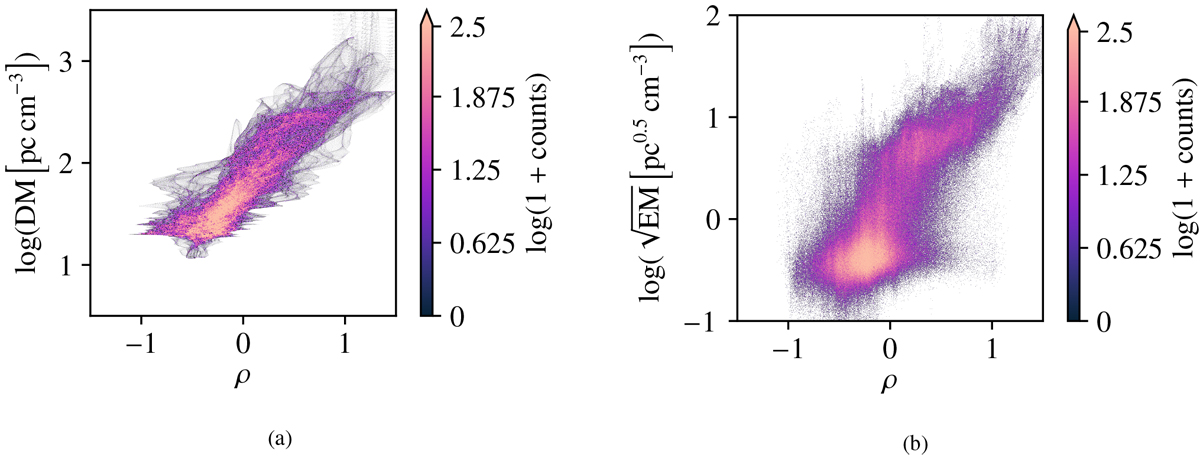
Histogram of sky pixels illustrating the correlation between the log amplitude field, ρ, and the logarithmic DM (panel a) and the logarithmic square root EM (panel b) skies, respectively. The former is calculated from a Galactic thermal electron model (Yao et al. 2017), while the latter is inferred by the Planck survey from extinction-free microwave data (Planck Collaboration X 2016).
Current usage metrics show cumulative count of Article Views (full-text article views including HTML views, PDF and ePub downloads, according to the available data) and Abstracts Views on Vision4Press platform.
Data correspond to usage on the plateform after 2015. The current usage metrics is available 48-96 hours after online publication and is updated daily on week days.
Initial download of the metrics may take a while.