Fig. 10
Download original image
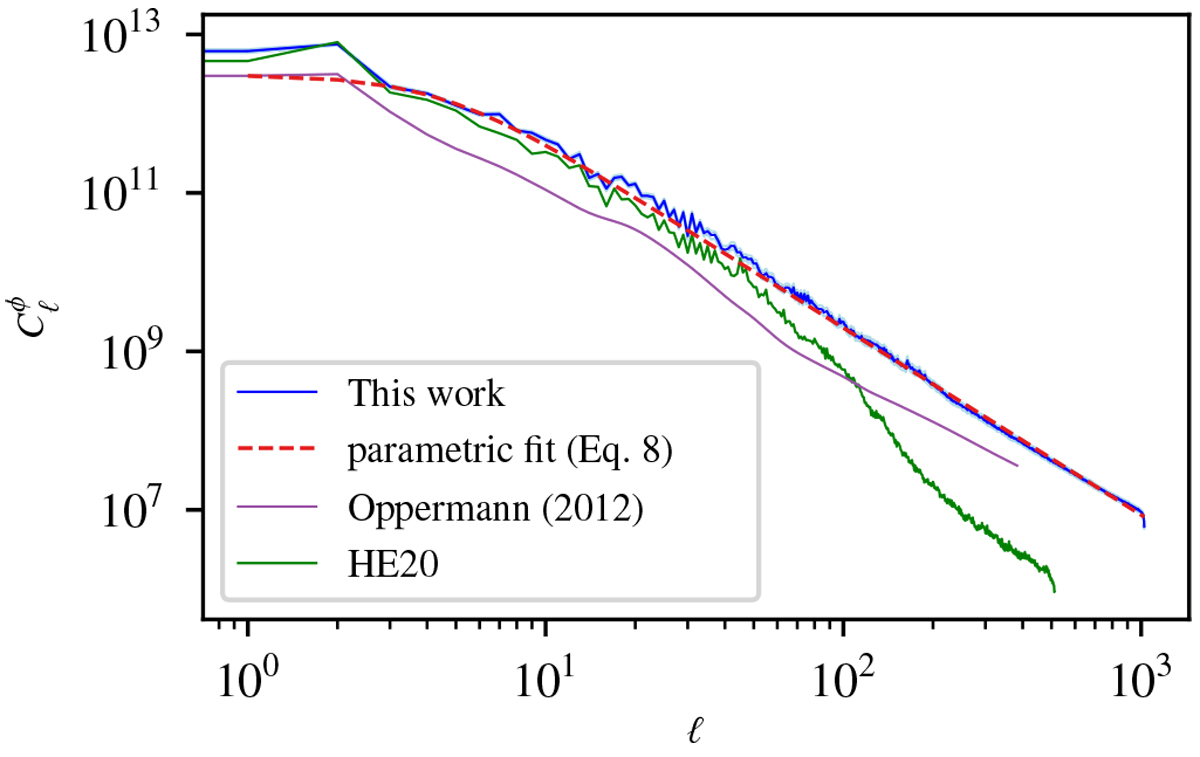
Power spectrum for the Faraday rotation sky derived in this work, compared with results from HE20 and Oppermann et al. (2012). Red dashed line indicates a parametric fit to the results of this work using Eq. (8). The uncertainties of the spectrum derived in this work are indicated by light-blue lines, which are only slightly offset from the dark-blue lines showing the mean.
Current usage metrics show cumulative count of Article Views (full-text article views including HTML views, PDF and ePub downloads, according to the available data) and Abstracts Views on Vision4Press platform.
Data correspond to usage on the plateform after 2015. The current usage metrics is available 48-96 hours after online publication and is updated daily on week days.
Initial download of the metrics may take a while.