Fig. 1
Download original image
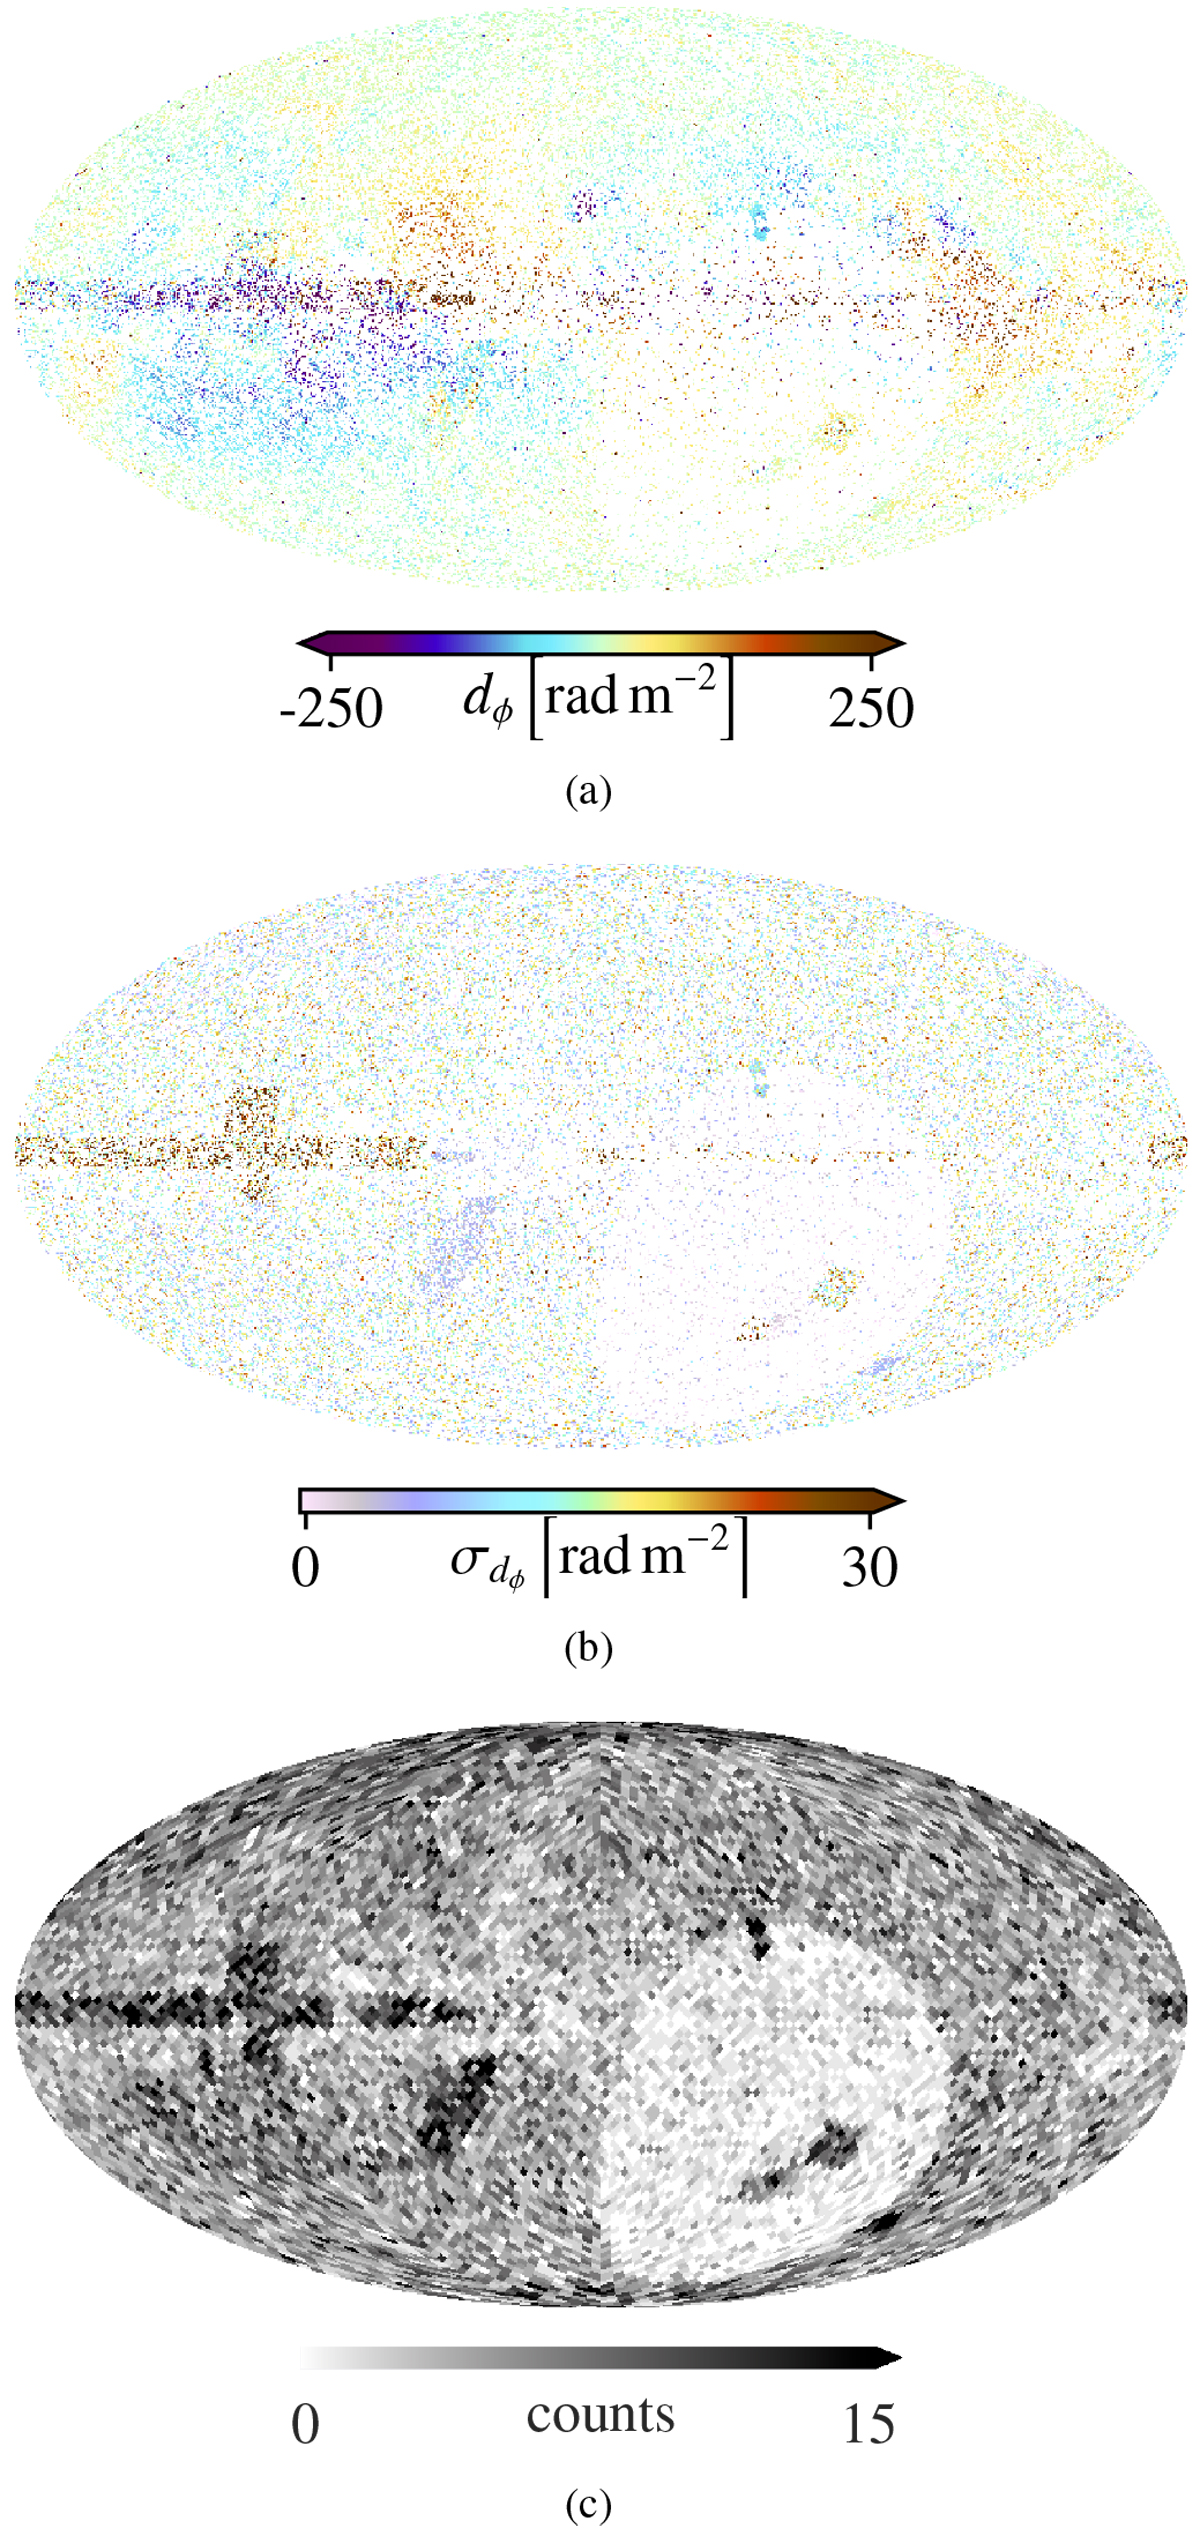
Sky projections of the data set used in this work, the associated observational errors and the source density. Panel a shows the Faraday data, panel b the observed error bars. Data points falling into the same pixel have been averaged. These plot has been made with a four-times decreased resolution (corresponding to an pixel area of 0.21 deg2 or 7.56 × 10² arcmin2) compared to that of the inference in order to enable better visualization. Panel c shows the source density of the data set used in this work. The pixels in this map have an area of about 3.36 deg2 or 1.2 × 10⁴ arcmin2, again for visualization purposes. These, and all subsequent maps, are presented in Galactic coordinates centered at
![]() .
.
Current usage metrics show cumulative count of Article Views (full-text article views including HTML views, PDF and ePub downloads, according to the available data) and Abstracts Views on Vision4Press platform.
Data correspond to usage on the plateform after 2015. The current usage metrics is available 48-96 hours after online publication and is updated daily on week days.
Initial download of the metrics may take a while.