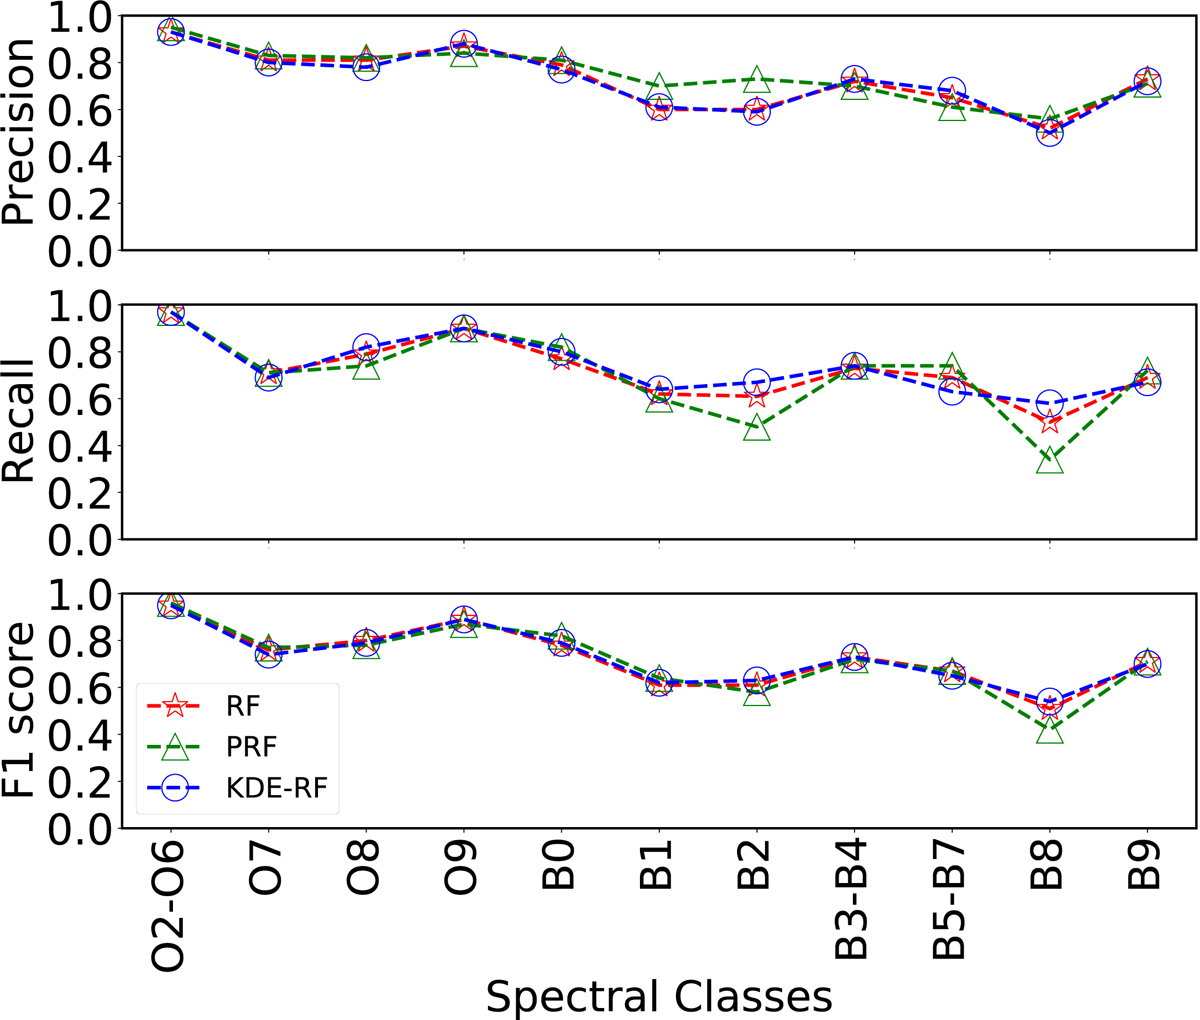
Fig. 9.
Download original image
Comparison of the three models used in this work. Stars and triangles correspond to the results from the RF and PRF algorithms, respectively. The results from our method are shown with open circles. We find that all the methods are consistent, indicating the robustness of the RF algorithm for the automated spectral classification of OB stars. The majority of spectral classes are predicted with a score higher than 65%, while the lower performance of some classes is either due to their inadequate representation in the initial sample or due to overlap of the EW distributions of their characteristic spectral lines with those of other classes (see Sect. 5.1).
Current usage metrics show cumulative count of Article Views (full-text article views including HTML views, PDF and ePub downloads, according to the available data) and Abstracts Views on Vision4Press platform.
Data correspond to usage on the plateform after 2015. The current usage metrics is available 48-96 hours after online publication and is updated daily on week days.
Initial download of the metrics may take a while.