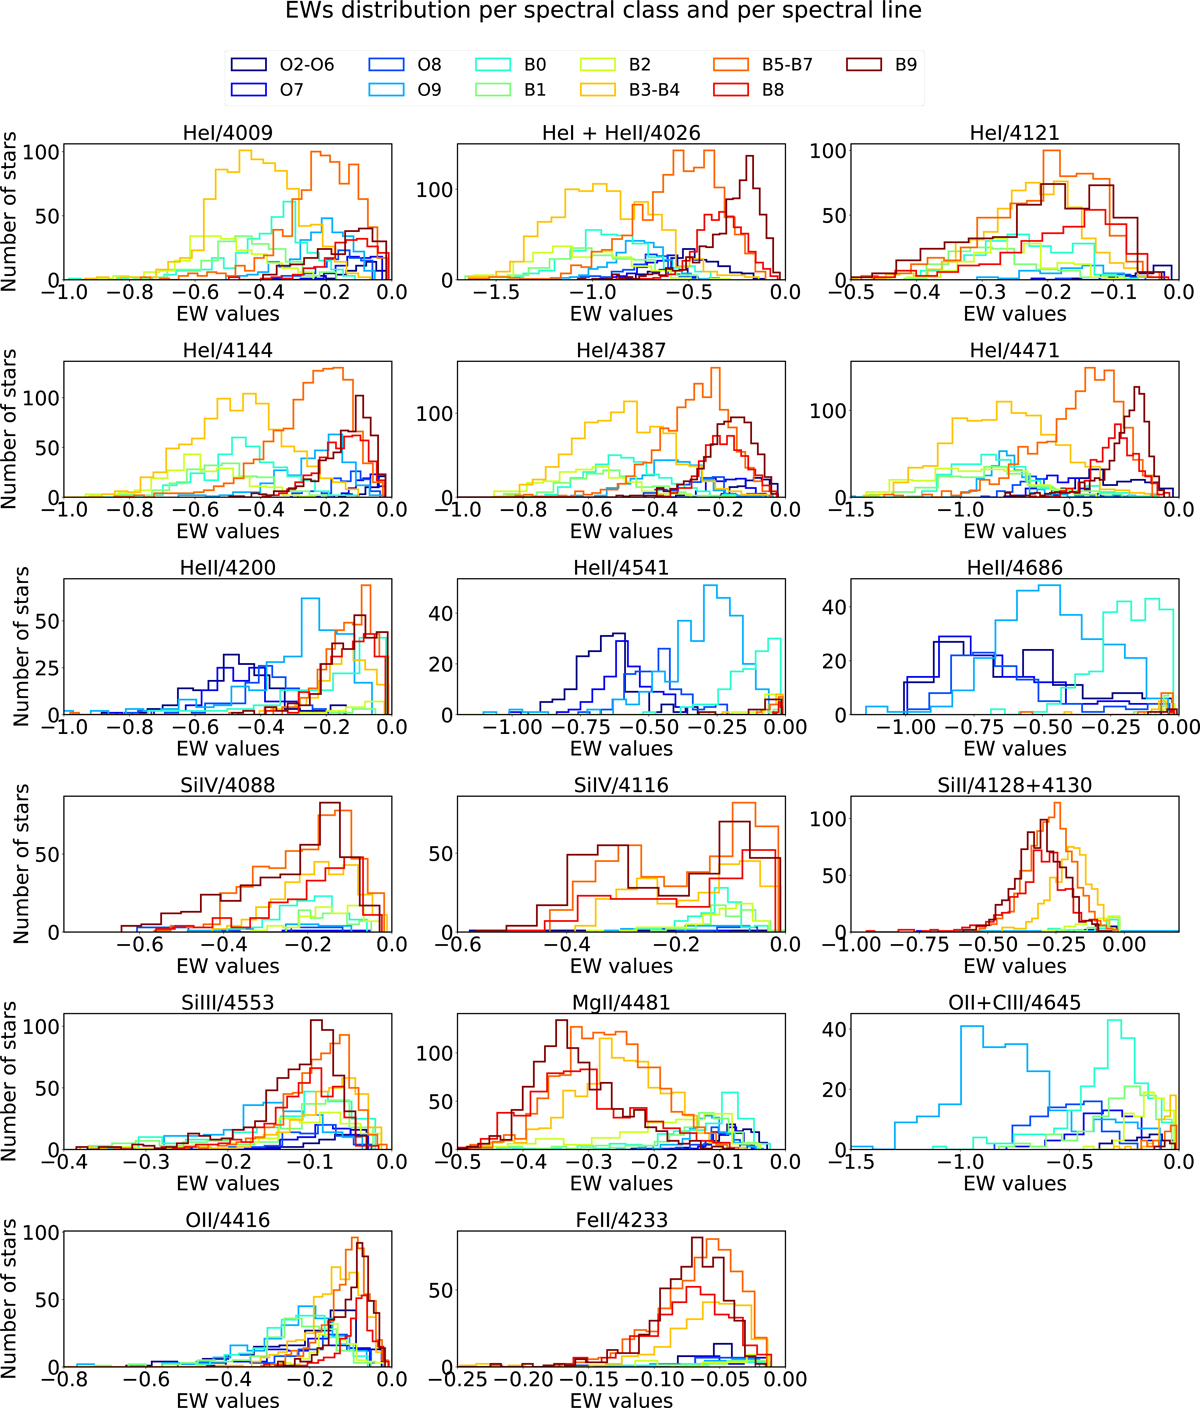
Fig. 6.
Download original image
Distribution of EW values per spectral class and per spectral line for the full set of features as it is presented in Table 2. The best-separated distributions of spectral lines coincide with the result of SFFS analysis (see Sect. 3.3). Based on these distributions, as well as the result of the SFFS analysis, we constructed the final scheme of features that it is used throughout this work (Table 2).
Current usage metrics show cumulative count of Article Views (full-text article views including HTML views, PDF and ePub downloads, according to the available data) and Abstracts Views on Vision4Press platform.
Data correspond to usage on the plateform after 2015. The current usage metrics is available 48-96 hours after online publication and is updated daily on week days.
Initial download of the metrics may take a while.