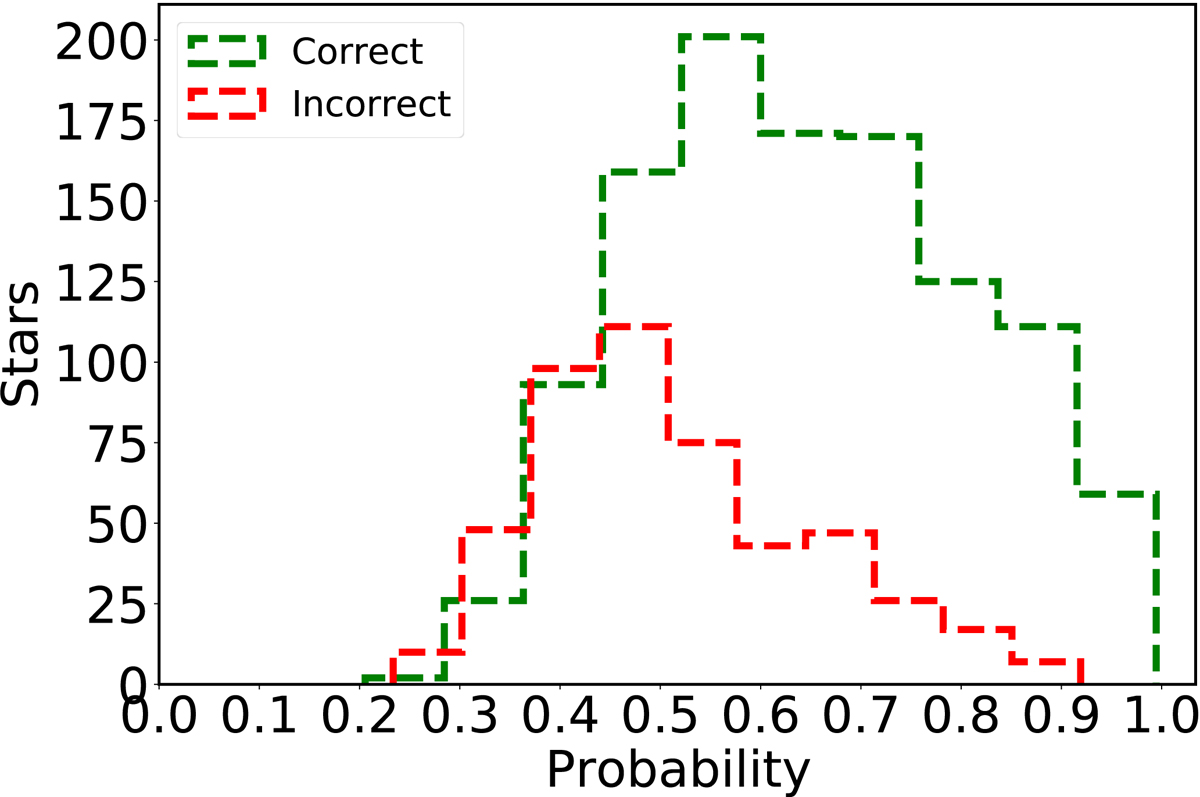
Fig. 10.
Download original image
Probability distributions between the sources that were predicted correctly (green dashed line) and incorrectly (red dashed line). The medians of the two distributions are 0.64 and 0.49, respectively. Based on these distributions, we define three flags regarding the reliability of our results. In particular, suggested spectral types with probability > 0.64 are flagged as strong candidates, while those with probability < 0.48 are flagged as candidates. For the intermediate range, 0.48–0.64, they are flagged as good candidates.
Current usage metrics show cumulative count of Article Views (full-text article views including HTML views, PDF and ePub downloads, according to the available data) and Abstracts Views on Vision4Press platform.
Data correspond to usage on the plateform after 2015. The current usage metrics is available 48-96 hours after online publication and is updated daily on week days.
Initial download of the metrics may take a while.