Free Access
Fig. 1.
Download original image
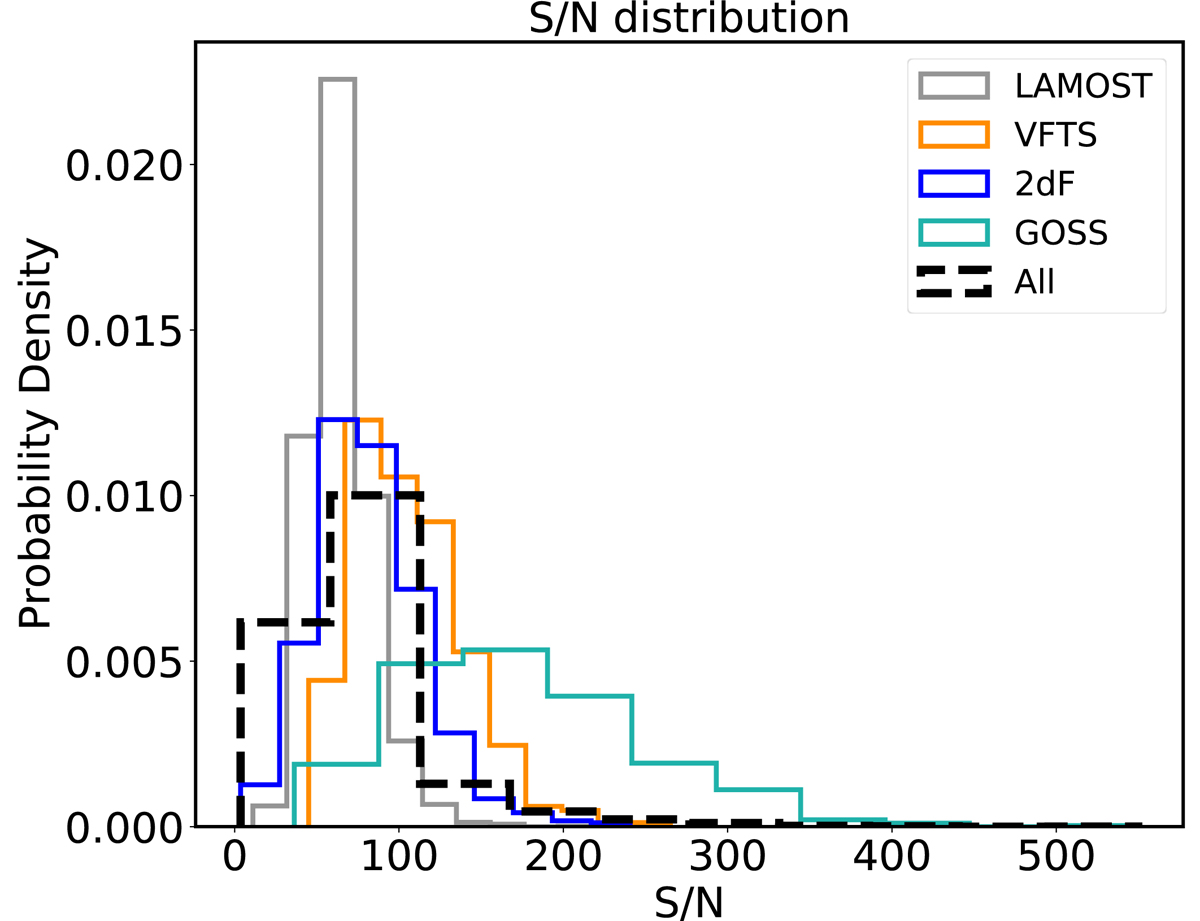
S/N distribution per survey as it is measured in a clear continuum region within the wavelength range 4220–4280 Å. The statistical mode for “All” distribution is ∼42, and the 95th percentile is ∼159. Based on this result, we continued our analysis by only taking into account spectra with S/N > 50.
Current usage metrics show cumulative count of Article Views (full-text article views including HTML views, PDF and ePub downloads, according to the available data) and Abstracts Views on Vision4Press platform.
Data correspond to usage on the plateform after 2015. The current usage metrics is available 48-96 hours after online publication and is updated daily on week days.
Initial download of the metrics may take a while.