Free Access
Fig. 9
Download original image
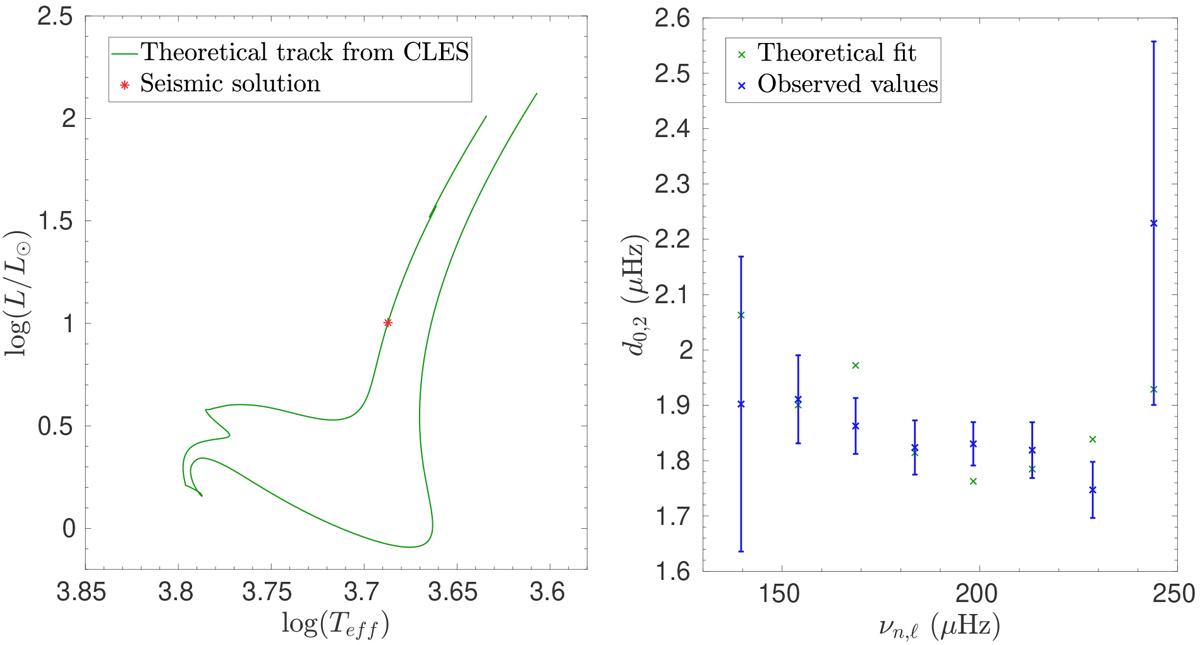
Left panel: HR diagram showing the CLES evolutionary track and the position of the optimal seismic solution. Right panel: agreement of the d0,2 for the optimal solution with the values determined from TESS data.
Current usage metrics show cumulative count of Article Views (full-text article views including HTML views, PDF and ePub downloads, according to the available data) and Abstracts Views on Vision4Press platform.
Data correspond to usage on the plateform after 2015. The current usage metrics is available 48-96 hours after online publication and is updated daily on week days.
Initial download of the metrics may take a while.