Free Access
Fig. 6
Download original image
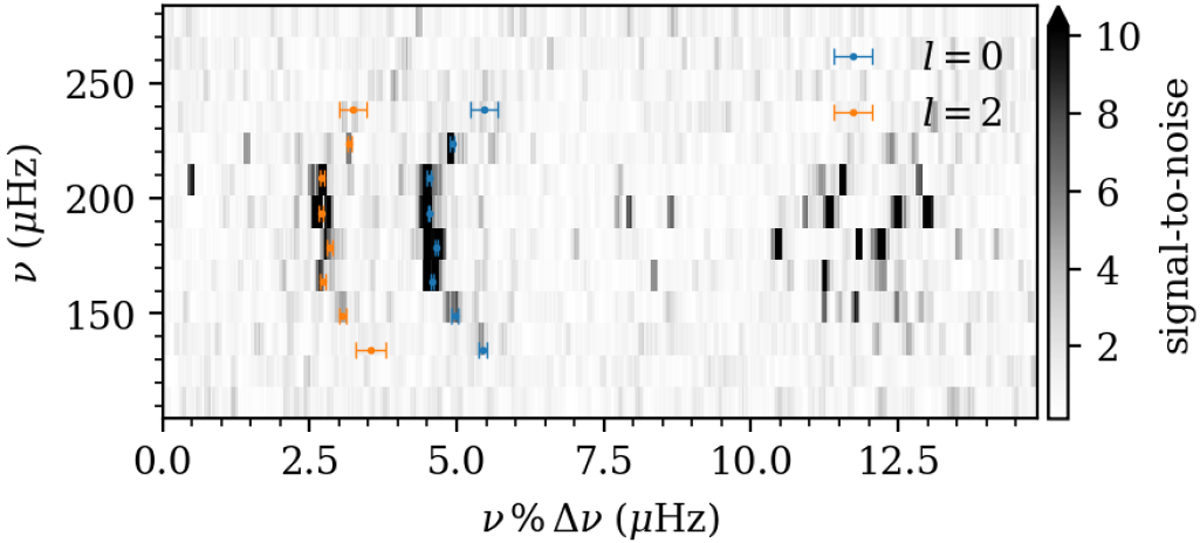
Echelle diagram for HD 29399 (TIC 38828538). The signal-to-noise ratio in frequency, ν, modulo the large frequency separation, Δν = 14.93 μHz. The locations of radial, l = 0 (blue), and quadrupolar, l = 2 (orange), oscillation modes are shown with error bars given by their 68% credible regions.
Current usage metrics show cumulative count of Article Views (full-text article views including HTML views, PDF and ePub downloads, according to the available data) and Abstracts Views on Vision4Press platform.
Data correspond to usage on the plateform after 2015. The current usage metrics is available 48-96 hours after online publication and is updated daily on week days.
Initial download of the metrics may take a while.